Nuovi strumenti per la CSR: dalla tradizionale mappa degli stakeholders alla rete neurale complessa. Metodi innovativi per una raffigurazione delle relazioni tra un’azienda e i suoi pubblici e per la narrazione delle storie d’impresa

Obiettivo di questo saggio – riassunto di un lavoro più ampio – è esporre alla comunità dei relatori pubblici una ricerca nel campo della Responsabilità Sociale d’Impresa (CSR) durata alcuni anni e ora applicata con successo alla rendicontazione integrata di alcune aziende italiane. Il testo nella prima parte riassume il percorso teorico che – partendo dalla logica fuzzy ad insieme sfumati – illustra un evoluzione nel modo di intendere la CSR e i rapporti tra gli stakeholder, inquadrandoli in un più ampio contesto e suggerendo l’utilizzo di modelli matematici quali quelli tipici delle Reti neurali complesse per tentare una predizione del comportamento degli stakeholder stessi. Queste riflessioni teoriche ci hanno anche permesso di ipotizzare un nuovo modello di mappa degli stakeholder, in grado di meglio evidenziare la totale coincidenza di interessi tra l’azienda e i suoi pubblici. Nella seconda parte, il saggio illustra i nostri progressi pratici nella rendicontazione aziendale, ovvero: l’applicazione della nuova mappa degli stakeholder, con un posizionamento di ogni stakeholder sulla mappa non “causale” ma basato su un metodo matematico guidato dai risultati della compilazione di apposite checklist da parte di focus group creati presso ogni stakeholder, checklist che permettono di definire il grado di reciproca influenza verso e dall’azienda/organizzazione e anche il grado di crisi potenziale, e nel contempo la creazione di un report annuale integrato (“One Report”) on-line 365 giorni all’anno, che permette una forte interazione tra l’azienda e gli stakeholder, i quali interagiscono con essa per la redazione del report, e una totale disintermediazione, mediante un apposito “cruscotto di indicatori” aziendali liberamente accessibili da ogni utente interessato in qualunque momento senza dover attendere la pubblicazione di fine anno del report.
Le implicazioni pratiche di questi metodi sono molteplici, per pubblici relatori, CSR manager e consulenti in CSR per aziende e organizzazioni, in quanto consentono un reporting aziendale verso gli stakeholder più efficace, completo e trasparente. Da verifiche effettuate tramite studi professionali di Avvocati specializzati in copyright e trademark, e anche sulla rete internet, non risulta siano stati ad oggi codificati sistemi simili per la mappatura degli stakeholder di imprese/organizzazioni.
Keywords: logica Fuzzy, mappa degli stakeholder, bilancio sociale, Corporate Social Responsibility (CSR), crisis communication, reti neruali, management d’impresa.
Questo breve saggio è stato elaborato tra il dicembre 2008 ed il gennaio 2009, sulla base di appunti precedenti, e segue i miei ragionamenti di fine 2007 sulla Teoria dei giochi applicata alle relazioni pubbliche, e quelli di settembre 2008 sulla dimensione etica della vita d’impresa nei periodi di crisi.
In questo lavoro vorrei sollecitare i lettori – ed in particolare i colleghi – a riflettere sul rapporto esistente tra il ruolo di un’impresa ed un’istituzione al giorno d’oggi, ed i rispettivi pubblici d’interesse.
Ma vorrei andare oltre le note ipotesi di dottrina, e tentare di fornire un contributo per quanto possibile originale alla discussione su questi temi, ponendo in correlazione gli algoritmi di apprendimento delle intelligenze artificiali con la dottrina della Corporate Social Responsibility, la Responsabilità Sociale d’Impresa, nota agli addetti ai lavori con l’acronimo “CSR”.
Partiamo da ciò che è noto. E’ ormai consapevolezza diffusa che le aziende – complice anche un accesso più diretto all’informazione da parte degli utenti – sono fortemente interconnesse all’ambiente che le circondano, ben più che rispetto al passato, o perlomeno esse sono maggiormente coscienti di questo loro ruolo, e quindi investite di nuove responsabilità che non possono ignorare, se non a rischio di essere relegate ai margini del quadro competitivo.
A tal proposito, tempo fa sul mio sito internet scrivevo: “Il Premio Nobel Milton Friedman dichiarò negli anni ’80 che l’unica azione “socialmente responsabile” a carico di un’azienda sarebbe stata pagare le tasse. Il tempo ha mutato profondamente questo concetto, ed oggi la globalizzazione ha generato nuove preoccupazioni ed aspettative nei consumatori, nelle comunità, nelle autorità pubbliche, negli investitori. Questo è vero per la grande multinazionale, come per il piccolo stabilimento: le aziende sono fortemente radicate e connesse con il territorio dove operano e con la società in generale, spesso molto più di quanto l’imprenditore stesso riesca a percepire. Come sia stato possibile per decenni considerare un’azienda, che è un organismo vivo, come totalmente avulsa dall’ambiente nel quale opera, resta un mistero”. Ed infine aggiungevo: “Le aziende oggi devono decidersi a fare i conti con un mercato veramente ‘globale’ – non solo in senso geografico, com’è noto da decenni – bensì in quanto ‘parte della rete neuronale’ della società all’interno della quale operano”.
Dobbiamo ora riflettere sulle attuali modalità di “mappatura” di una rete di stakeholders, i pubblici interessanti ed interessati per un’azienda, per un’istituzione, e – perché no – per un individuo (avete mai provato a disegnare la vostra ‘personale’ rete di stakeholders, le persone, i gruppi, le entità dalle quali dipendete come persone fisiche, sforzandovi di capire cosa state facendo per loro e cosa loro fanno – o non fanno – per voi? Illuminante…). Tradizionalmente, l’azienda è rappresentata al centro del foglio: intorno ad essa, collegati da una linea ciascuno, vi sono i vari portatori d’interesse. Questa modalità di rappresentazione va a mio avviso ben oltre l’aspetto meramente grafico, e finisce per coinvolgere nel profondo l’aspetto filosofico di questa materia: il modo con il quale percepiamo il nostro ruolo ed intendiamo rapportarci – nel senso più ampio del termine – a ciò che ci circonda. Per comprendere il perché, dobbiamo prima approfondire alcuni aspetti legati alla storia della logica.
Agli inizi dei ruggenti anni ’60, all’Università di Berkeley, Lotfi Zadeh, un Professore molto noto per i suoi contributi alla teoria dei sistemi, si convinse che le tecniche tradizionali di analisi di tale teoria erano così schematiche e “precise” da risultare inadeguate a descrivere molti dei problemi tipici di quell’epoca di forte rinnovamento. In quegli anni, in molti settori dominava ancora il “principio di non contraddizione”, proprio della logica Aristotelica. In logica classica, il principio di non contraddizione afferma l’incongruenza di ogni affermazione la quale implichi che una certa proposizione “A” e la sua negazione – diciamo la proposizione “non-A” – sono allo stesso tempo entrambe vere. Aristotele infatti diceva che “…non è lecito affermare che qualcosa sia e non sia nello stesso modo ed allo stesso tempo…”. Banalizzo: siamo certi che tizio è sempre sincero, da ciò deriva che ogni sua affermazione è vera. Se l’affermazione “X” di tizio si rivela falsa, sussiste quindi un’illogica: o è falsa la prima asserzione (che tizio è sempre sincero), o è errato sostenere che l’affermazione “X” sia falsa. Quel che è certo – secondo la logica Aristotelica – è che le due cose non possono coesistere nello stesso modo ed allo stesso tempo. Ciò è in linea anche con il comune buon senso, perché se fosse possibile quanto sopra, sarebbe vero tutto ed il contrario di tutto. Un sistema logico dove sia considerato valido il principio di non contraddizione, e dove nel contempo sia anche presente una contraddizione – ossia sia completamente vera un’affermazione ed anche una sua negazione – è un sistema in realtà privo di logica e di struttura, poiché tutte le affermazioni sono vere, comprese le loro negazioni: quindi non può essere interessante, poiché non comunica alcuna informazione “certa”.
Dal punto di vista pratico, ne è derivato un approccio deterministico basato sulla logica binaria, approccio che è stato la regola per secoli, il quale prevede che impostando dati esatti e programmando rigidamente un processo, i risultati derivanti non potranno che essere precisi.
Tuttavia, il Prof. Zadeh – ed altri poco prima di lui, con lui e dopo di lui, come il Prof. Lukasiewicz – elaborò una nuova teoria, che alcuni percepirono inizialmente in contraddizione con la logica aristotelica – e ne nacquero accese discussioni accademiche – ma che invece si rivelò essere, come vedremo, una sua evoluzione dettata dallo sviluppo dei tempi e del pensiero: la logica “ad infiniti valori di verità”, basata sul concetto di “insiemi sfumati”, anche conosciuta come “logica fuzzy” (da indeterminato, sfumato, sfocato…).
Si tratta di un approccio alla logica in cui si può attribuire a ciascuna proposizione un grado di “verità variabile” compreso tra un valore 0 ed un valore 1. Quest’intuizione, utilissima per spiegare molti fenomeni moderni, era stata tratteggiata già prima da ricercatori del calibro di Bertrand Russel ed Albert Einstein, ma venne codificata in modo articolato per la prima volta dal Prof. Zadeh. Quando parliamo di grado di verità o valore di appartenenza intendiamo dire – disorientando un po’ le nostre mentalità cartesiane, pregnate dal concetto “o e vero o è falso, o è bianco o è nero” – che una certa proprietà oltrechè essere vera (cioè con valore 1) o falsa (cioè con valore 0) come prevede la logica classica, può anche essere contraddistinta da valori intermedi: vero è che “o si è vivi o si è morti” (valore 1 o valore 0) ma altrettanto vero è che – in logica fuzzy – si può assegnare ad un neonato valore 1, ad un ragazzo appena maggiorenne valore 0,8, ed a un anziano pensionato settantenne valore 0,15. Detta così può apparire banale, ma la codificazione di questa riflessione sotto forma di algoritmi matematici avviò – come vedremo – una vera e propria rivoluzione nel mondo della logica moderna.
Qualcuno ha azzardato paragoni tra la logica fuzzy e la teoria delle probabilità, ma quest’ultima descrive eventi casuali bivalenti, che si verificano oppure no, senza valori intermedi. Per capire la differenza tra logica fuzzy e teoria della probabilità, richiamiamo questo esempio, “pescato” dal web: un lotto di 100 bottiglie d’acqua ne contiene 5 di veleno. Diremo allora che la probabilità di prendere una bottiglia d’acqua potabile è 0,95. Tuttavia una volta presa una bottiglia, o è potabile, o non lo è: le probabilità collassano a 0 od 1, mentre i valori fuzzy possono variare da 0 ad 1 (come le probabilità) ma – diversamente da queste – descrivono eventi che si possono verificare “in una certa misura”, secondo un certo “grado di appartenenza” ad un dato insieme.
A metà anni ’90 il Prof. Zadeh diceva: “In senso ampio, il termine ‘logica fuzzy’ è sinonimo di ‘teoria degli insiemi fuzzy’: una teoria di classi con contorni indistinti“. La teoria degli insiemi fuzzy costituisce un’estensione della teoria classica degli insiemi poiché per essa non valgono i principi aristotelici di non contraddizione, che prevedono che – dati due insiemi A e non-A (per esempio menzogna e verità) – ogni elemento appartenente all’insieme A non può contemporaneamente appartenere anche all’insieme non-A. In altri termini, secondo la logica classica – fatti in ipotesi due soli insiemi – se un qualunque elemento non appartiene all’insieme A, esso necessariamente deve appartenere al suo complemento, l’insieme non-A. Tali principi logici conferiscono un carattere di rigida bivalenza all’intera costruzione aristotelica, caratteristica che ritroviamo sostanzialmente immutata sino alla prima metà del XX secolo, quando il concetto di insiemi sfumati proprio della logica fuzzy ha permesso di dissolvere la lunga serie di paradossi cui la bivalenza della logica classica aveva dato luogo, e che essa non aveva mai chiarito. Il più antico e celebre di tali paradossi è quello noto come “paradosso del mentitore” ed è attribuito a Eubulide di Mileto, il quale nel IV secolo avanti Cristo diceva: “Il cretese Epimenide, afferma che i cretesi sono bugiardi”. Si noti che, a rigor di logica classica, se è vero che i cretesi sono bugiardi – quindi anche Epimenide – la sua affermazione è falsa, quindi i cretesi sono sinceri, quindi anche lui è sincero, quindi i cretesi sono bugiardi, e via discorrendo senza soluzione. Semplificando all’essenziale, potremmo affermare seguendo la stessa struttura paradossale: “questa frase è falsa”, e così mandare in corto circuito un computer. Ma ciò che ci interessa dimostrare è che la logica aristotelica si dimostra incapace di stabilire se queste proposizioni siano vere o false. Essa è strutturalmente incapace di dare una risposta, proprio in quanto bivalente, cioè perché ammette due soli “valori di verità”: vero o falso, bianco o nero, tutto o niente. Ciò implica che ogni tentativo di risolvere la questione posta dal paradosso sopra citato si traduce in un’oscillazione senza fine tra due estremi opposti. N definitiva, la logica Aristotelica non era in grado di dare risposte efficaci ai nuovi problemi che la società moderna poneva dinnanzi ai ricercatori ed agli analisti.
Secondo i teorici della logica fuzzy, l’enunciato del paradosso di Eubulide di Mileto non è né vero né falso, ma è semplicemente una mezza verità o, in maniera equivalente, una mezza falsità. Le due possibili conclusioni del paradosso si presentano nella forma contraddittoria A e non-A, e questa sola contraddizione è sufficiente ad inficiare la logica bivalente. Ciò al contrario non pone alcun problema alla logica fuzzy, poiché, quando il cretese mente e non mente allo stesso tempo, lo fa solo al 50%, e questo vale per qualunque paradosso di questo genere, seguendo principi logici “sfumati”, ovvero con “valori di verità frazionari”. Il che – tra l’altro – ci stimola a riflettere sul concetto di sincerità e sul nostro rapporto con le tante “verità” che circondano il nostro vivere quotidiano.
L’idea di “grado d’appartenenza”, concetto divenuto poi la spina dorsale della teoria degli insiemi sfumati, fu introdotta a metà anni ‘60 da Jan Lukasiewicz, e ciò portò in seguito alla pubblicazione di un primo articolo scientifico, ed alla nascita della logica sfumata ad opera del Prof. Zadeh. Il concetto di insieme sfumato e di logica sfumata attirò aspre critiche della comunità accademica tradizionale, ma ciò nonostante ottenne un immediato seguito in diverse discipline. In Giappone la ricerca sulla logica sfumata cominciò con due piccoli gruppi universitari fondati agli inizi degli anni ’70. A metà degli anni ’70, in Inghilterra venne sviluppato il primo sistema di controllo di un generatore di vapore basato sulla logica fuzzy, e venne anche ideata un’applicazione industriale della logica fuzzy per il controllo di una fornace per la produzione di cemento. Come ci ricordano gli appassionati utenti di Wikipedia, nel corso degli anni ottanta, diverse importanti applicazioni industriali della logica fuzzy furono lanciate con successo in Giappone: l’Hitaci realizzò un sistema automatizzato per il controllo operativo dei treni metropolitani della città di Sendai. Un’altra applicazione di successo della logica fuzzy è un sistema per il trattamento delle acque di scarico sviluppato dalla Fuji Electric. Dopo questi primi esperimenti riusciti, ci fu un vero e proprio boom della logica fuzzy applicata all’industria. Agli inizi degli anni ‘90, la Matsushita Electric Industrial Co. diede il nome di “Asai-go (Moglie adorata) Day Fuzzy” alla sua nuova lavatrice a controllo automatico, e lanciò una campagna pubblicitaria in grande stile per il prodotto “fuzzy”. La campagna si rivelò un successo commerciale non solo per il prodotto, ma anche per la tecnologia stessa, ed il termine d’origine estera “fuzzy” fu introdotto nella lingua giapponese con un nuovo significato: intelligente. Molte altre aziende elettroniche seguirono le orme della Panasonic e lanciarono sul mercato aspirapolveri, fornelli per la cottura del riso, frigoriferi, videocamere con stabilizzatori per l’inquadratura sottoposta ai bruschi movimenti della mano, macchine fotografiche con un autofocus più efficace. La parola “fuzzy” vinse il premio per il neologismo dell’anno, ed i successi giapponesi stimolarono un vasto interesse per questa tecnologia in Corea, in Europa e negli USA.
La logica fuzzy trovò presto applicazioni anche in campo finanziario. Il primo sistema per le compravendite azionarie ad usare la logica sfumata è stato lo Yamaichi Fuzzy Fund, che tratta la maggioranza dei titoli quotati dell’indice Nikkei Dow, e consiste nella combinazione di algoritmi matematici basati sulla logica fuzzy, verificati – e se necessario modificati – ogni mese da analisti esperti. Il sistema è stato testato per un periodo di due anni, e le sue prestazioni in termini di rendimento hanno superato l’indice Nikkei Average di oltre il 20%. Durante il periodo di prova, il sistema consigliò “sell” (vendere) ben diciotto giorni prima del lunedì nero delle borse del 19 ottobre 1987. Nell’informatica, il primo microchip basato sulla logica fuzzy fu sviluppato agli inizi della seconda metà degli anni ‘80: chip di tal genere sono in grado di migliorare le prestazioni dei sistemi per tutte le applicazioni che richiedono scelte in tempo reale, e diverse imprese commercializzano strumenti hardware e software per lo sviluppo di sistemi a logica sfumata. Per render l’idea – ecco un altro utile esempio proposto da un navigatore del web – una semplice applicazione pratica della logica a sistemi sfumati potrebbe essere la misura di una temperatura per un sistema anti-blocco di un impianto frenante, che potrebbe avere diverse funzionalità a seconda di particolari range di temperature, per controllare i freni nel migliore dei modi. Le tre funzioni, cold, warm e hot farebbero da riferimento, con tutte le variabili intermedie: finché il valore punta a zero, la funzione hot non è vera (“temperatura non calda”), la funzione warm è vera solo in piccola parte (si può descrivere a parole come “poco tiepido”), ed al contrario la freccia blu (che punta a 0,8) indica che la funzione cold è abbastanza vera (“fresca, abbastanza fredda”). Potrebbe apparire banale, con i nostri occhi di osservatori smaliziati del XXI secolo, ma quello che va compreso è che la matematica basata sulla tradizionale logica aristotelica non permetteva di governare con adeguata efficacia questi processi.
Per chi ha avuto la pazienza di leggere questo saggio fino a questo punto, iniziamo ora ad approfondire la correlazione esistente tra una particolare applicazione dei principi della logica fuzzy e la Corporate Social Responsibility (CSR).
Gli sviluppi nella logica fuzzy hanno contribuito all’istituzione di una nuova disciplina scientifica che ha consentito il rinnovamento del settore dell’intelligenza artificiale, disciplina nota con il nome di “soft computing”. Le tecniche di soft computing si prefiggono di valutare, calcolare, decidere e controllare lo scenario in un ambiente impreciso, vago, fluido o soggetto a continui e repentini cambiamenti, emulando e utilizzando la capacità degli esseri umani di eseguire le suddette attività sulla base della loro esperienza. Sono tre gli assi portanti di questa disciplina:
– la possibilità di modellare e di controllare sistemi incerti e complessi, nonché di rappresentare la conoscenza in maniera efficiente attraverso le descrizioni tipiche della teoria degli insiemi fuzzy;
– la capacità d’ottimizzazione degli algoritmi matematici, la cui computazione si ispira alle leggi di selezione e mutazione tipiche degli organismi viventi;
– la capacità di apprendere complesse relazioni funzionali delle reti neurali, ispirate a quelle proprie dei tessuti cerebrali.
Secondo Zadeh, “…una tendenza crescente è costituita dall’uso della logica fuzzy in combinazione con il calcolo neurale e gli algoritmi genetici. Più in generale, la fuzzy logic, le reti neurali e gli algoritmi genetici possono considerarsi i principali costituenti di ciò che potrebbe essere definito ‘calcolo soft’. A differenza dei metodi di calcolo tradizionali o ‘hard’, il soft computing ha lo scopo di adattarsi alla pervasiva imprecisione del mondo reale. Il suo principio guida può esprimersi così: sfruttare la tolleranza per l’imprecisione, l’incertezza e le verità parziali in modo da ottenere trattabilità, robustezza e soluzioni a basso costo. Nei prossimi anni, il soft computing è probabilmente destinato a giocare un ruolo sempre più rilevante in molti settori”. Tra i tratti caratteristici di questo scenario, troviamo dati non certi, ambigui o incompleti, casualità e soluzioni quanto più approssimate possibili: la vita vera, insomma, nei confronti della quale la logica fuzzy rappresenta un vero e proprio “sistema adattativo” efficace.
Eravamo partiti all’inizio di questo saggio richiamando graficamente una tradizionale “mappa degli stakeholders”. Possiamo affermare senza timore di smentita che la mappa degli stakeholders tradizionalmente intesa possa venire ricondotta ad un sistema di logica classica aristotelica: o sei uno stakeholder o non lo sei (“o è vero o è falso”, valore 0 o valore 1): niente più che un mero elenco rappresentato graficamente. Se sei ritenuto tale, sarai oggetto di attenzione, diversamente no.
Già da alcuni anni, applico alcuni principi elementari della logica fuzzy alle mie mappe degli stakeholders. Un banale accorgimento che non tralascio mai di prendere è – ad esempio – quello di evidenziare con una linea più o meno lunga il collegamento tra l’entità mia mandante e lo stakeholder, laddove la lunghezza della linea vettoriale di collegamento è direttamente proporzionale al grado di attenzione di cui esso gode in quel dato momento storico in assenza di situazioni di crisi, mentre un codice a “colori sfumati” indica sulle mie mappe la possibilità dell’approssimarsi di una situazione di crisi (grado di “possibile appartenenza” ad una situazione di crisi) ed anche – nel rispetto del principio della “verità variabile” – il livello di attuale predisposizione dell’entità mandante ad assorbire e gestire con efficacia l’ipotetica crisi.
Ora, ho promosso nel mio staff un’ulteriore riflessione, afferente il concetto di rete neuronale, o “neurale”, per dirla con un termine scientificamente ortodosso.
Le più complete enciclopedie on-line ci ricordano che “…Il cervello è una complessa organizzazione di cellule nervose, con compiti di riconoscimento delle configurazioni assunte dall’ambiente esterno, memorizzazione e reazione agli stimoli”. Al fine di compiere queste operazioni, la rete biologica cerebrale si serve di miliardi di semplici elementi computazionali (neuroni) fittamente interconnessi in modo da variare la loro configurazione in risposta agli stimoli esterni: in questo senso può parlarsi di processi di evoluzione per apprendimento, ed i sistemi d’intelligenza artificiale cercano di replicare questo modello. Il neurone è costituito da tre parti principali: il corpo cellulare, la linea di uscita del neurone (unica, ma che si dirama in migliaia di rami) e la linea di entrata del neurone, che riceve segnali in ingresso dalle linee di uscita degli altri neuroni tramite le sinapsi. Il corpo cellulare esegue una valutazione dei segnali in ingresso: se il risultato supera un certo valore di soglia, allora il neurone si attiva. Se il risultato invece non supera il valore di soglia, il neurone rimane in uno stato di riposo.
Tradizionalmente, il termine “rete neurale” viene utilizzato come riferimento ad una rete o ad un circuito di neuroni biologici, ma se ne è affermato l’uso anche in matematica, con riferimento ai modelli matematici delle reti neurali artificiali, che rappresentano l’interconnessione tra elementi definiti neuroni artificiali, ossia costrutti matematici che in qualche misura “imitano” le proprietà dei neuroni viventi. Una rete neurale artificiale è un’interconnessione di un gruppo di nodi, chiamati neuroni: è un sistema “adattativo”, uno strumento di modellazione che cambia la propria struttura sulla base delle informazioni che scorrono attraverso la rete durante la fase di apprendimento.
Questi modelli matematici sono utilizzati per risolvere problemi di intelligenza artificiale come quelli che si pongono in diversi ambiti tecnologici: in ingegneria, elettronica, informatica, ed in altre discipline. Dalle ricerche che ho fatto, nessuno aveva mai però tentato prima d’ora di applicarli alla CSR.
Il concetto di neurone artificiale venne proposto per la prima volta negli anni ’40, in alcune ricerche che cito nella bibliografia di questo saggio, e che stimolarono una quantità di studi e ricerche che durò oltre vent’anni, suscitando un vivo interesse e notevoli aspettative nella comunità scientifica. Dopo un periodo di stasi per tutti gli anni ’60 e ’70, a causa dei limiti operativi delle prime semplici reti ancora inadeguate a risolvere molte classi di problemi complessi, negli anni ’80 vennero sviluppati i primi modelli di reti neurali artificiali davvero efficaci.
L’aspetto che più ha attirato l’interesse dei ricercatori, è la possibilità di “apprendimento” della rete artificiale: dato un compito specifico da risolvere, apprendimento significa utilizzare l’osservazione del risultato al fine di trovare una funzione che risolva il problema in modo ottimale. La funzione di costo è un concetto importante nell’apprendimento: si tratta della misura di “quanto è lontana da noi” la soluzione ottimale del problema che vogliamo risolvere, e quindi qual è lo sforzo richiesto per raggiungerla. Gli algoritmi di apprendimento ricercano soluzioni al fine di trovare una funzione che abbia il minor “costo” possibile. L’addestramento di une rete neurale avviene – banalizzo, mi perdonino gli addetti ai lavori – sollecitando i nodi in ingresso con una propagazione in avanti dei segnali attraverso ciascun livello della rete, confrontando la risposta della rete con il risultato desiderato ottenendo un corrispondente segnale d’errore in caso di difformità, e propagando poi nella direzione inversa rispetto a quella delle connessioni sinaptiche il segnale di errore, “educando” così la rete a minimizzare la differenza tra l’uscita ottenuta e l’uscita desiderata. Esistono diversi paradigmi di apprendimento, utilizzabili per regolare il compito di una rete neuronale, ma quest’analisi ci porterebbe su di un terreno eccessivamente tecnico e sofisticato che esula dalle mie competenze e non rileva ai fini delle nostre riflessioni. Ci basti accennare al fatto che lo scopo dell’attività di apprendimento di una rete neurale artificiale è quello di individuare il modo di operare ottimale a partire da un processo di osservazione dell’ambiente esterno: ogni azione ha un impatto sull’ambiente, e l’ambiente produce una “retroazione” che guida l’algoritmo stesso nel processo d’apprendimento. Questo sistema postula un agente, dotato di capacità di percezione, che esplora un ambiente nel quale intraprende una serie di azioni. L’ambiente stesso fornisce in risposta un incentivo o un disincentivo, secondo i casi, ed il sistema così apprende e si evolve. E’ anche d’interesse notare come in una rete neurale un ingresso di dati molto importante avrà un peso elevato, mentre un ingresso poco utile all’elaborazione avrà un peso inferiore, e di come le connessioni tendano ad irrobustirsi quando le unità presinaptica e postsinaptica sono d’accordo, altrimenti tendano ad “indebolirsi”. Lo stesso si può dire della CSR, laddove un flusso costante di attenzione tende a qualificare il rapporto con uno stakeholder, ed al contrario l’ingnorare completamente uno stakeholder ci pone nell’impossibilità di percepire l’avvicinarsi della più grave delle crisi.
Nei più moderni modelli di rete neurale, il flusso d’informazioni non è solo bidirezionale – ovvero nella direzione che conduce dagli ingressi alle uscite, e viceversa – ma la propagazione può anche manifestarsi da uno strato neurale successivo ad uno precedente, oppure tra neuroni appartenenti ad uno stesso strato, e persino tra un neurone e sé stesso. Questo è vero anche nella CSR: la nostra azione di input verso uno stakeholder, non finirà per generare una rielaborazione di informazioni anche all’interno dello stakeholder stesso, modificando il suo assetto e lo scenario con il quale esso è obbligato a confrontarsi? E queste modifiche, non finiranno inevitabilmente per produrre alterazioni – in positivo ma anche in negativo – all’interno del perimetro dei pubblici d’interesse del nostro stakeholder? Nelle reti neurali artificiali, al termine di ogni fase del processo di apprendimento, il nodo avente un vettore di pesi più vicino ad un certo risultato desiderabile è considerato “vincitore”, ed tutti i pesi sono aggiornati in modo da avvicinarli a tale valore. Dato che ciascun nodo ha un certo numero di nodi adiacenti, quando un nodo vince una competizione, anche i pesi dei nodi adiacenti sono modificati, secondo la regola generale che più un nodo è vicino al nodo vincitore tanto più marcata è la variazione dei suoi pesi. Durante la fase di addestramento si costruisce la mappa, pertanto la rete si configura ed organizza tramite un processo competitivo. Questo è esattamente ciò che succede su di una mappa di stakeholder, laddove una buona prassi ha buone possibilità di venir adottata da tutto il network e diventa quindi il nuovo valore di riferimento.
Dal momento che una rete neurale è normalmente utilizzata per simulare relazioni complesse tra ingressi e uscite che altre funzioni analitiche non riescono a rappresentare, essa è a mio avviso anche il miglior modello per rappresentare le fitte interconnessioni esistenti tra un dato soggetto ed i propri pubblici d’interesse: sia quelli noti e “mappati”, sia quelli che dipendono a loro volta da quelli a noi noti, ma dei quali magari non conosciamo neanche l’esistenza.
I compiti ai quali le reti neurali sono chiamate a dare risposte variano dai sistemi di controllo di veicoli e di processi industriali, alle funzioni di approssimazione per la previsione delle tempeste meteorologiche, alla simulazione di videogame, all’identificazione di volti, lineamenti e caratteristiche biometriche, al riconoscimento di oggetti per la sicurezza negli aeroporti, alla verifica di processi decisionali, ed a molto altro ancora. Perché non utilizzarle allora per simulazioni nel campo della CSR?
Vero è che – come per qualsiasi algoritmo complesso – anche le reti neurali sono efficienti solo se le variabili “predittive” sono scelte con cura, e che il funzionamento di una rete neurale artificiale – una volta a regime – è talmente sofisticato da impedire all’analista una ricostruzione esatta delle modalità di raggiungimento di un dato risultato, riducendo così di fatto il potere di controllo sull’intero processo. Inoltre, non esistono teoremi o modelli tali da definire una rete come “ottimale”, quindi l’efficacia di una rete dipende molto dall’esperienza del suo creatore.
Pur tuttavia, come avevo già esposto nel mio saggio sulla Teoria dei Giochi, partendo da quanto ho sopra illustrato dovrebbe essere possibile per i ricercatori elaborare soluzioni innovative per la CSR, che permettano gli addetti ai lavori di uscire dal limite costituito dal “lo faccio perché ho visto cos’hanno fatto altri e penso possa funzionare”, oppure del “facciamo così perché si è sempre fatto così”.
Nell’attesa di ottenere il supporto di qualche esperto nella materia per elaborare uno o più modelli matematici predittivi utili per aiutarci a superare anche nella CSR la trappola del “posso imparare solo sbagliando”, sistema poco profittevole dal punto di vista dei costi, iniziamo ad applicare questi concetti alla filosofia che in generale regola il nostro lavoro di tutti i giorni.
Basta con le mappe di stakeholders a due dimensioni, se è vero – come tutti sosteniamo, e questo concetto è alla base della teoria della Corporale Social Responsibility – che l’azienda mandante è parte di una rete di relazioni molto complessa. Il modello di rete neurale artificiale è a mio avviso in grado di rappresentare efficacemente la realtà delle interazioni tra un’azienda od un’istituzione e tutti i pubblici interessati ed interessanti per essa, perché è di tutta evidenza che – come ho esposto sopra – un input inserito nella rete (dei nostri stakeholders) sollecita i nodi in ingresso (lo stakeholder oggetto di attenzione in quel momento) con una propagazione in avanti del segnale, ci porta poi a confrontare la risposta della rete (dell’intera rete dei nostri stakeholders) con il risultato desiderato, ottiene eventualmente un corrispondente segnale d’errore in caso di difformità, e propaga poi nella direzione inversa il segnale, “educando” l’intera rete a minimizzare la differenza tra l’uscita ottenuta e l’uscita desiderata. Che ci piaccia a no, questo è l’effetto che otteniamo quando prendiamo l’iniziativa di sollecitare la nostra rete di portatori d’interesse, e mille ed una case-history sono lì a dimostrarlo.
La catena spagnola di distribuzione di moda Zara, del gruppo Inditex, impose ad un proprio fornitore del Bangladesh la chiusura di una fabbrica consorella, dopo che la rete televisiva BBC aveva avvisato gli spagnoli delle violenze fisiche e verbali a cui i lavoratori erano esposti e delle pessime condizioni ambientali nelle quali lavoravano gli operai. Con fatica, gli ispettori di Zara riuscirono a visitare la fabbrica oggetto della denuncia, e gli ispettori spagnoli riscontrarono condizioni talmente deplorevoli da porre un aut-aut al proprio fornitore ufficiale: o chiudeva quella fabbrica, impegnandosi a ricollocare al proprio interno i lavoratori che altrimenti sarebbero rimasti disoccupati, oppure avrebbe interrotto i rapporti con il fornitore. Il fornitore accettò le condizioni degli spagnoli e ricollocò gli operai della fabbrica incriminata. L’operazione venne supervisionata da osservatori indipendenti, ed inoltre il fornitore di Zara si impegnò a riconoscere i sindacati in tutte le proprie fabbriche. Ecco un esempio tipico di come un input inserito all’interno della rete degli stakeholders di una multinazionale ha generato un flusso di ritorno tale da condizionare – in positivo, in questo caso, ma non è sempre così – un numero di elementi dello scenario ben più ampio di quello inizialmente sollecitato.
Guna Spa, primo player italiano nel settore delle medicine naturali ed omeopatiche, e tra le prime 5 aziende al mondo in quella categoria merceologica, non prevede come soluzione di prima linea in caso di difformità qualitative dei propri fornitori l’interruzione dei rapporti commerciali – pratica assai diffusa per tutelarsi nei confronti dell’opinione pubblica e della stessa magistratura. Guna è conscia che ciò genererebbe un contraccolpo negativo sui lavoratori dell’impresa fornitrice, i quali hanno un basso livello di responsabilità nello scenario e rischiano però di pagarne per intero il prezzo. Nel codice etico per i fornitori di quest’azienda si legge: “…GUNA Spa è coscente dell’importanza del ruolo delle proprie aziende fornitrici nel loro sistema socio-economico, specie in quanto di generatori di reddito essenziale per le famiglie dei dipendenti e piccoli azionisti, nonchè dell’importanza che tali aziende rivestono a loro volta per i propri fornitori che le approvvigionano di materie prime. In caso di non rispondenza – in tutto od in parte – ai criteri dettati dalla presente Carta etica, l’opzione di prima scelta di GUNA Spa non sarà quindi la repentina e definitiva interruzione del rapporto di fornitura, quanto piuttosto – risolta efficacemente l’emergenza e tutelato ad ogni costo ed in ogni modo possibile l’interesse dei cittadini e dei pazienti, e sempre con riguardo alla gravità delle violazioni – l’erogazione a cura e spese di GUNA Spa di servizi di tutoraggio ed accompagnamento al fine di migliorare lo scenario esistente presso il fornitore, impedendo il ripetersi del problema…”. Questo è un esempio di comportamento adattivo per apprendimento, volto a migliorare lo scenario esistente “educando la rete” neurale nella quale Guna si trova ad operare ed a competere.
Il ministro del Tesoro della Pennsylvania, Robin L. Wiessmann, annunciò il disinvestimento dalla multinazionale China Petroleum & Chemical Corporation (Sinopec), responsabile di operare in Sudan, dove il governo di Khartoum traeva fondi dalle attività delle compagnie straniere per rifornire di armi i responsabili del genocidio nella regione del Darfur. Il disinvestimento da Sinopec fu pari a 1,2 milioni di dollari, una cifra non enorme, e venne adottato dopo il rifiuto di China Petroleum di dialogare con gli azionisti sui rischi della sua presenza in Sudan. Il ministro della Pennsylvania assunse questa decisione sulla base di una modifica delle politiche d’investimento dello Stato, che incluse anche valutazioni geopolitiche, ambientali, di governance e altri fattori strategici. Anche a seguito di questa decisione, che stimolò discussioni tra gli analisti e nella classe politica, il presidente Americano – allora George W. Bush – firmò una legge che consentiva – e consente tutt’ora – alle autorità statali e locali di ritirare i propri investimenti da società che operano in Sudan, a causa della violenza nel Darfur. Questo è un altro caso nel quale l’azione verso uno stakeholder ha poi creato effetti ben più ampi del previsto.
Gli esempi potrebbero essere molti altri, ma ciò che è chiaro è che le aziende e le istituzioni dimostrano – a volte senza averne neanche piena consapevolezza – di agire come parte di una “rete neurale sociale”. Sta allora ai professionisti del settore far proprie queste riflessioni ed aumentare il grado di consapevolezza proprio e delle proprie clienti, adottando sistemi predittivi più sofisticati ed adatti ad aumentare l’indice di controllo sugli scenari complessi che le sfide del XXI secolo ci pongono innanzi. Quello che è certo, è che il nostro livello di responsabilità e la qualità dei meccanismi di governance devono innalzarsi rapidamente, come diretta conseguenza alla presa di consapevolezza del grado d’impatto delle nostre determinazioni su entità con le quali non siamo apparentemente collegati.
Complice anche la moderna tecnologia ed i social network, ogni entità – individuale o collettiva – è immediatamente e stabilmente connessa con i propri referenti, e risponde quotidianamente al torrente di stimoli, informazioni ed emozioni di cui viene investita: ciò rende chiaro come ogni entità non sia nient’altro che un “nodo” di un sistema più ampio, che io ho definito rete neurale sociale. Come ci racconta Derrick de Kerckhove, nel suo breve ma bellissimo saggio dal titolo “Nel mio corpo c’è un robot”, questa rete è “veloce, trasparente, potenzialmente ubiqua e liquida”. E come vi ho descritto in questo mio lavoro, ogni input inserito varia marcatamente lo scenario, sia quello “di prossimità” che quello – più o meno distante, magari da noi nemmeno “mappato” – con il quale siamo in contatto solo attraverso altri nodi: semplicemente, dato che ciascun nodo ha un certo numero di nodi adiacenti, quando un nodo vince una competizione (un’azione su di uno stakeholder che migliora/peggiora il nostro profilo reputazionale), anche i pesi dei nodi adiacenti sono modificati (anche gli altri stakeholders migliorano/peggiorano il nostro rating, ed avviano a loro volta procedure interne per migliorare il proprio), nel rispetto della regola generale che più un nodo (uno stakeholder) è vicino al nodo vincitore tanto più marcata è la variazione dei suoi pesi. In questo mondo di interazione continua ed immediata, non è forse quello che accade quando sollecitiamo in qualche modo i nostri stakeholders? Certamente uno stakeholder di prossimità – come un fornitore, od i dipendenti – sarà più sensibile ai nostri input, ma anche i clienti del nostro fornitore verranno a loro volta sollecitati, ed anche la famiglia del nostro dipendente probabilmente trarrà giovamento dal nostro intervento.
Già i Veda indiani – migliaia di anni fa – ci indicavano come parti di “un Uno unico, interdipendenti l’uno dall’altro”, connessi, al di la delle distanze, molto più strettamente di quanto noi si possa sospettare. Potremmo allora scrivere e discutere anche della Corporate Social Responsibility come di una disciplina utile a disegnare i contorni ed a valorizzare l’esistenza di una “suprema rete neurale”: la rete complessa che a livello planetario pone in relazione ognuno di noi con l’altro, ogni istituzione con un’altra istituzione, ogni azienda con le altre aziende, e tutti questi elementi organicamente tra loro.
Una rete neurale che è la naturale evoluzione di un sistema sociale, od è la prova di un atto di creazione?
Una delle ultime ricerche che ho condotto per promuovere il concetto di responsabilità sociale come dimensione strategica della vita d’impresa, si propone di dare riscontro all’esigenza sempre più sentita di “misurazione” della CSR, al fine di tentare di traghettare fuori da un concetto meramente empirico – e verso un approccio più scientifico – sia la disciplina che la metodologia professionale di chi se ne occupa quotidianamente per lavoro.
La base teorica del metodo che abbiamo elaborato è contenuta nella prima parte di questo saggio, elaborato nel 2008, dove ipotizzavo l’applicazione dei principi della logica fuzzy e dei meccanismi di funzionamento delle reti neurali artificiali alla CSR ed alla mappatura degli stakeholder, partendo dal presupposto che “tutti i pubblici sono stakeholder” e riflettendo sugli effetti che ha il comportamento dell’azienda – che è parte di una rete neurale complessa – sugli “stakeholder degli stakeholder”, troppo spesso trascurati. Ho da tempo infatti raggiunto – come anche altri colleghi – alcune consapevolezze, che, a rischio di banalizzare, provo a sintetizzare per ulteriore chiarezza:
• l’azienda è parte di una rete sociale molto più ampia di quanto normalmente si sospetti;
• questo assioma è una verità, lo si può ignorare come si può far finta di non avere un braccio tenendolo legato dietro la schiena, ma esso resterà vero;
• le azioni dell’azienda verso i suoi stakeholder influenzano questa rete neurale ben oltre essi, sia dal punto di vista funzionale che da punto di vista identitario;
• tutti sono/siamo stakeholder, non esistono “influenti”. E’ solo un diverso grado di interconnessione (in applicazione della logica ad insiemi sfumatI) che caratterizza i diversi pubblici, anche quelli meno di prossimità;
• da ciò ne deriva che l’azienda è responsabile per tutti loro (e noi professionisti per essa, quando indirizziamo la comunicazione della Cliente su quei vettori);
• l’azienda non HA degli stakeholder, bensì E’ i propri stakeholder, nel senso che le due entità coincidono, così come gli interessi dell’azienda coincidono con gli interessi dei suoi stakeholder (a meno che uno degli elementi in causa non abdichi alla dimensione etica del proprio lavoro)[1];
• non esiste – e questo ci riguarda da vicino, ha a che fare con la nostra capacità di gestire complessità per conto della Cliente – una misura del “caos insostenibile”, bensì solo un grado di entropia relativo, che definisce “una misura della complessità dell’ordine nel quale volente o nolente dobbiamo imparare ad orientarci”;
• tanto più si ignorano questi principi, tanto più ci si espone al rischio di una crisi. Una crisis è semplicemente il frutto di un basso grado di interconnessione con uno stakeholder, laddove diminuendo l’interazione diminuisce proporzionalmente il valore informativo dell’azione dello stakolder stesso verso l’azienda, e quindi il grado di controllo dell’azienda verso il “lavoro” – inteso nell’accezione che ne danno le scienze fisiche – interno al sistema disegnato dalla mappa degli stakeholder[2]
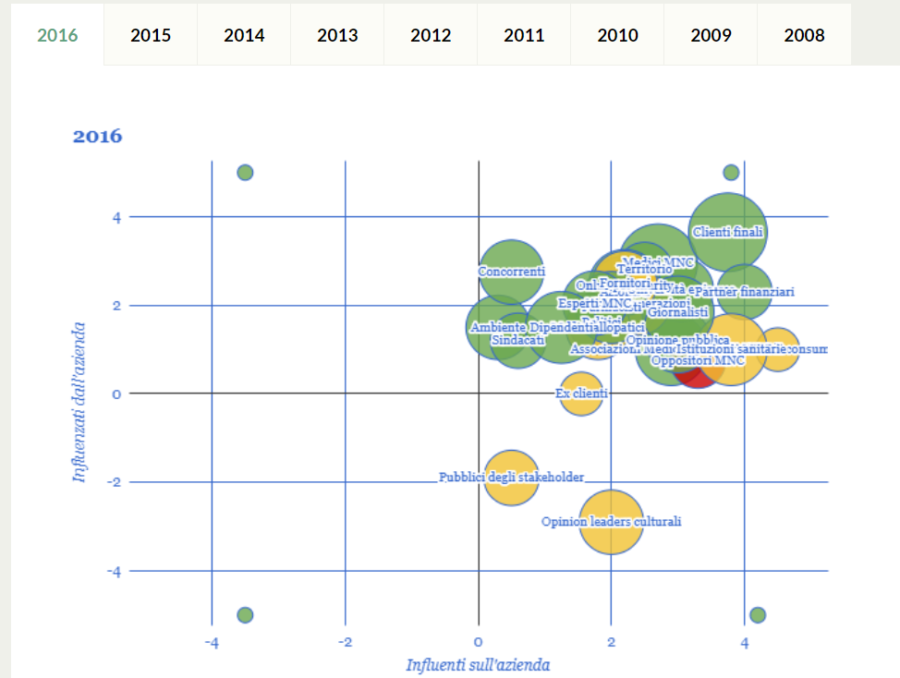
Partendo da questi presupposti, già da alcuni anni nelle mie mappe degli stakeholder è “sparita” l’azienda, tradizionalmente raffigurata al centro della mappa stessa: l’organizzazione è diventata una “texture” di fondo, sulla quale sono a loro volta disegnati gli stakeholder, rappresentazione questa che evidenzia ancor meglio la “coincidenza” tra l’azienda stessa ed i suoi pubblici.
Abbiamo quindi – prima internamente, poi discutendone in seminari per addetti ai lavori, e dal 2008 applicando la nuova mappatura anche sui Clienti – iniziato a raffigurare le mappe degli stakeholder su un grafico cartesiano a quadranti[3], costruito per l’occasione, e in grado di misurare con maggiore efficacia rispetto alle mappe tradizionali il grado di “influenza”, di interconnessione e di crisi potenziale dell’azienda con riguardo a ognuno dei suoi pubblici.
Pur tuttavia, i dati necessari per posizionare correttamente gli stakeholder sul grafico derivavano ancora della restituzione di una pur articolata azione di audit interno effettuata dai noi consulenti: il grado di approssimazione, di soggettività relativa, del metodo, mi lasciava ancora insoddisfatto.
Ho quindi creato – con il prezioso supporto del mio staff – uno strumento[4] che valuta in modo più analitico il grado e la tipologia della responsabilità sociale aziendale, e che definisce un quadro di riferimento univoco e il più possibile personalizzato, nell’ambito di precisi standard di riferimento, permettendo tra l’altro la comparazione tra imprese sulle performance che concorrono allo sviluppo sostenibile, come già hanno fatto in termini di classificazione dell’intero bilancio sociale le linee guida internazionali GRI che tutti conosciamo.
Questo del quale sto parlando è un criterio riproducibile di determinazione del posizionamento degli stakeholder su di una mappa cartesiana a quadranti. La metodologia viene applicata con lo scopo di fornire strumenti per valutare il grado di stakeholder engagement tra l’azienda ed i suoi pubblici, e permette di inserire correttamente questi ultimi sulla mappa, mediante un sistema di attribuzione di “punteggi” che non elide l’apporto dell’osservazione professionale del consulente, ma anzi la valorizza, equilibrandola con dati oggettivi derivanti dalla contemperazione dei risultati dell’audit con la percezione che l’azienda ha di se e che gli stakeholder a loro volta hanno dell’azienda.
Ecco gli elementi principali in cui si articola il metodo:
• Form da far compilare per avere una prima percezione dello stato dell’arte riguardo la CSR dell’azienda:
Si richiede di compilarlo per raccogliere le informazioni fondamentali atte a identificare la sensibilità e il grado di “alfabetizzazione” sulla CSR dell’azienda e il suo “kit” di strumenti di base necessari al buon fine di un progetto di CSR.
• Questionario di valutazione/checklist SH per SH:
Il questionario è elaborato “ad hoc” per ogni categoria di stakeholder (non li riporto in questo paper solo per ragioni di spazio, sono decine di pagine).
Ad ogni domanda viene attribuito un punteggio compreso tra -2 e +2 che definisce il “livello di maturità” raggiunto dall’azienda rispetto alla materia d’analisi. Nell’assegnazione del punteggio si fa riferimento ai seguenti valori:
– 2 assente
– 1 basso
0 medio
+ 1 alto
+2 molto alto
La compilazione verrà affidata:
– al manager responsabile della funzione alla quale fa riferimento la materia d’analisi (consulente esterno CSR o CSR manager interno);
– a un gruppo rappresentativo di dipendenti/dirigenti (è fondamentale la presenza di dipendenti legati alla funzione di cui sopra);
– a un gruppo rappresentativo dello stakeholder di riferimento, o in stretto subordine dal CSR manager/consulente esterno nel caso in cui il coinvolgimento di un gruppo rappresentativo di stakeholder comportasse un impiego di risorse tale da porre a repentaglio la sostenibilità del progetto.
Per ogni stakeholder – o gruppo di stakeholder, laddove più stakeholder dovessero essere per praticità accorpati in un’unica categoria – è stata redatta un’articolata checklist suddivisa in tre sezioni, A, B, C, funzionali l’una all’altra (ognuna di esse verrà quindi compilata da tutte e 3 le categorie professionali pocho sopra elencate):
Sono state effettuate delle simulazioni, anche per inserire nel metodo di computazione dei valori correttivi, al fine di garantire risultati il più possibile affidabili.
I valori del campo (A) definiranno la posizione sull’asse delle ascisse (x) influenzati per il 50% da (C) come fattore correttivo.
La dimensione del rettangolo in cui sono riportati gli stakeholder sulla mappa – dimensione che rappresenta l’importanza/controllo sullo SH percepito dall’azienda – è definita dal valore di (A) influenzato per il 30% da (B) come fattore correttivo.
I valori del campo (B) indicheranno la posizione sull’asse delle ordinate (y).
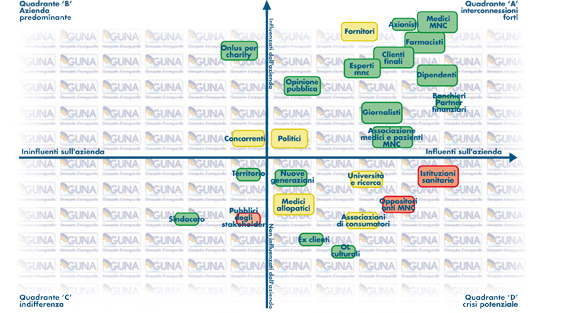
I valori del campo (C) avranno un’influenza del 30% sull’asse delle ascisse, ma soprattutto determineranno la scala cromatica relativa al profilo di crisi potenziale – in rapporto allo stakeholder – così classificata:
BOZZA DI MAPPA IMPOSTATA SECONDO IL NUOVO CRITERIO DI POSIZIONAMENTO[5]
(la forma grafica non è indicativa)
• COLORE VERDE: controllo, situazione favorevole e comunicazione costante;
• COLORE GIALLO: soglia di attenzione, situazione da monitorare e/o dialogo da intensificare;
• COLORE ROSSO: crisi potenziale e/o assenza di dialogo.
Anche se nella mappa proposta in bozza in questo articolo sono stati raffigurati a titolo di esempio solo 5 stakeholder, per un’ azienda “tipo” di medie dimensioni, operante in Italia nel comparto della produzione di beni di consumo, è stata definita una prima serie di stakeholder per i quali è stata elaborata un’apposita checklist di domande (ovviamente diversa da SH a SH):
1) ambiente
2) dipendenti
3) fornitori
4) clienti
5) comunità sociale
6) opinione pubblica/giornalisti/media
7) comunità finanziaria/banche/investitori
8) enti regolatori/istituzioni
9) associazioni di categoria/competitors
10) territorio
11) intermediari/corrispondenti commerciali
E’ di tutta evidenza che nella pratica professionale ogni azienda sarà oggetto di studio, e ogni mappa avrà caratteristiche peculiari e pubblici differenti da azienda ad azienda; di qui la necessità di elaborare sempre nuove checklist, andando a costruire un bagaglio di conoscenza e competenze che si arricchiranno ad ogni nuovo mandato, e che potremo poi utilizzare in modo dinamico nell’ambito dei vari mandati professionali.
I risultati ottenuti per ognuna delle categorie sopraindicate grazie alla compilazione delle checklist (management, dipendenti, stakeholder/CSR manager/consulente esterno), stakeholder per stakeholder, saranno elaborati secondo criteri di media aritmetica e in un primo momento permetteranno di constatare lo scostamento tra la percezione di ognuna delle tre categorie prese in considerazione rispetto ai rapporti sussistenti con un dato pubblico dell’azienda.
Un eventuale scostamento tra i risultati forniti da una categoria, superiore al 30% rispetto ad un’altra, sarà valutato come indice di criticità che dovrà essere esaminato e che concorrerà alla definizione di stato potenziale di crisi verso lo stakeholder.
Una volta correttamente definito il posizionamento degli stakeholder in base alla percezione globale (delle tre categorie), l’azienda, in base al posizionamento sulla mappa di ogni categoria di stakeholder, potrà – seguendo le indicazioni del United Nations Environment Program[6] – identificarsi consapevolmente in una delle seguenti fasi di sviluppo (sempre secondo punteggi variabili, in ossequio ad una logica a insiemi sfumati):
La mappa a questo punto sarà messa a confronto con quella “OBIETTIVO” definita dalla direzione/proprietà, la quale disporrà così di un nuovo strumento per allineare la propria strategia aziendale alle aspettative dei propri stakeholder interni ed esterni grazie all’adozione di risposte adeguate alle esigenze emerse durante il processo di audit e mappatura.
Ho ragione di ritenere che questo paper possa essere di utile stimolo per il dibattito tra colleghi e accademici, e ben volentieri accetterò ogni utile suggerimento o critica[8].
In una Sua recente riflessione su “Business”, Toni Muzi Falconi[9] richiamava all’attenzione dei lettori le caratteristiche della “rendicontazione organizzativa” nelle aziende (“Corporate storytelling”). L’impresa oggi si relaziona con pubblici molto diversi fra loro: “tradizionalmente – ricorda Muzi Falconi – i consumatori hanno rappresentato il terreno prediletto della sua comunicazione, per la semplice ragione che soltanto un’attività push di informazione sui prodotti e servizi poteva indurre le persone alla consapevolezza dell’esistenza di questi e stimolare all’acquisto. Ma oggi, a fianco dei consumatori, hanno assunto un ruolo fondamentale anche i dipendenti, gli investitori, i regolatori pubblici, i fornitori, le comunità locali e altri ancora, e ciascuno di questi intrattiene relazioni con l’azienda attraverso i canali più diversi”.
E’ quindi del tutto naturale che si producano narrative differenziate nei contenuti, nella forma, e negli strumenti utilizzati per dialogare con i propri pubblici di riferimento. D’altra parte, banale ricordarlo, la mappatura degli stakeholders dovrebbe essere propedeutica non solo alla rendicontazione nel bilancio sociale, bensì alla strutturazione di strategie di comunicazione e soprattutto di dialogo personalizzate con tutti i pubblici coinvolti. Da anni suggerisco ai Clienti di strutturare siti web multicanale, per avviare dinamiche di dialogo ad hoc con riguardo alle identità, caratteristiche e aspettative dei vari stakeholder.
Un ulteriore passo in avanti l’abbiamo fatto – dopo l’elaborazione delle necessarie basi teoriche illustrate nella prima parte di questo saggio – con la creazione dell’innovativa mappa degli stakeholder su assi cartesiani a quadranti, che permette di abbandonare una procedura per la definizione della posizione dei pubblici sulle mappe meramente empirica, basata solo sull’osservazione dei consulenti e sulle attività di audit, passando ad una procedura basata su criteri scientifici e più oggettivi.
Con Luca Yuri Toselli, ho alcuni mesi fa stimolato un’azienda Cliente ad aprirsi ulteriormente in direzione della trasparenza di processo e della condivisione non solo dei valori ma anche degli strumenti utilizzati per raccontarli.
Abbiamo quindi pubblicato la bozza di bilancio sociale dell’azienda in un apposito spazio web, aperto alla consultazione e soprattutto all’interazione con tutti i pubblici di riferimento dell’azienda. La versione definitiva successivamente stampata – su DVD, per risparmiare in termini di impatto ambientale – è stata quindi il frutto di queste “contaminazioni”, in linea con la nostra visione della teoria della CSR: l’azienda non fa CSR, ma è la propria CSR, e – se assumiamo come vera una totale coincidenza e sovrapposizione d’interessi tra l’impresa ed i suoi pubblici – l’atto di rendicontazione non può più avere alcun senso se predisposto dalla sola azienda al netto degli stakeholder, in modo unidirezionale. L’atto deve necessariamente essere “corale”, scritto a più mani con gli stakeholders, e condiviso con essi dalla stesura della prima parola sul foglio bianco di word.
Per queste ragioni, siamo inevitabilmente approdati ad uno step ancora successivo: abbiamo predisposto un articolato “cruscotto di indicatori dinamici” che – muovendo i passi dall’edizione del bilancio sociale anno 2010 – si sta andando ad arricchire di dati, tabelle, informazioni, e soprattutto storie, in un percorso lungo un anno, condiviso in totale trasparenza e di fatto “costruito” assieme a tutti i reparti aziendali e a tutti i soggetti che costituiscono la rete neurale aziendale. Nasce così il primo bilancio sociale “in tempo reale” mai pubblicato, che è anche di per se un metodo di stakeholder engagement in grado di trasformare i pubblici in elemento strategico per la definizione in co-management della CSR aziendale.
Anche la scelta dell’icona del progetto è stata un’occasione utile di confronto e di discussione: inizialmente pensavamo di evidenziare mediante il simbolo il valore immateriale della “trasparenza”. Sull’onda lunga dell’emozione generata dal 2.0 e dal concetto di “casa di vetro”, pensavamo quindi al ghiaccio, o ad una distesa d’acqua cristallina.
Ma, di nuovo, a noi pareva un approccio ormai obsoleto, un qualcosa del tipo “siamo aperti e trasparenti, se volete potete leggerci dentro”. Meglio di niente, ma puntavamo a qualcosa di ancora differente, volevamo fare un altro piccolo passo in più: enfatizzare il ruolo di “Grande Fratello” che con questo progetto riconoscevamo ai nostri stakeholder, parte di noi, ma anche soggetti “indagatori” dell’intimo dell’impresa.
Abbiamo quindi scelto come nome del progetto il neologismo “Web-Cam”, che richiama subito alla mente l’impossibilità di sottrarsi ai giudizi sul nostro modo di vivere il tempo e lo spazio da parte di soggetti “altri”, o di altre parti della poliedrica identità di ognuno di noi, parti per troppo tempo relegate al ruolo di semplici spettatori e fruitori di messaggi preconfezionati, e in linea con questo concetto come simbolo abbiamo scelto un simpatico pupazzone a forma di occhio, con la pupilla dilatata e una grande lente d’ingrandimento in mano. Il che, tradotto dalla simbologia alla narrazione, per noi significa: non siamo solamente pronti a farci guardare dentro, ma ti invitiamo a farlo, ti riconosciamo il diritto di farlo, e ti diamo anche gli strumenti per farlo con efficacia.
Chiaramente tutto ciò implica la disponibilità dell’imprenditore a mettersi veramente in gioco, al di la delle parole, della propaganda e del greenwashing. Per fortuna un’azienda italiana a forte carattere di innovazione ha già accettato la sfida[10]: vi terremo al corrente degli sviluppi.
A quando però un approccio veramente 2.0 da parte dei grandi gruppi? Perché per conoscere la produzione di automobili uscite dagli stabilimenti di una casa automobilistica questa settimana devo necessariamente contattare l’ufficio stampa del gruppo? Perché non posso saperlo, ora, senza mediazioni, connettendomi on-line e seguendo il filo di una “storia” che l’azienda mi racconta istante per istante, magari dando un mio contributo di idee su come vorrei che questa storia mi venisse raccontata?
Una nuova sfida in termini di condivisione, sia per i committenti che per noi relatori pubblici e comunicatori, che dovremo interpretarla.
Un approccio del genere, quasi totalmente disintermediato, renderà superfluo il nostro contributo professionale? Non penso, ci porterà casomai ad affinare i nostri strumenti, obbligandoci a fornire servizi a sempre più alto valore aggiunto. Che è poi il senso – da sempre – della nostra bellissima professione.
– Le checklist di riferimento per ogni stakeholder (elaborazione in corso di perfezionamento)
– L’autore: Luca Poma
– Breve bibliografia
NOTA: le checklist qui elencate, sono riportate a titolo meramente indicativo, in quanto lo strumento è in continua evoluzione e perfezionamento
A) Influenza dello stakeholder sull’ azienda
(asse orizzontale: influenti/ininfluenti per l’azienda)
A1 Implementazione delle politiche di sostenibilità ambientale
A2 Attenzione della produzione in termini di emissioni sull’ambiente.
A3 Attenzione all’impatto ambientale dei prodotti e servizi erogati dall’azienda.
A4 Considerazione dell’azienda in riferimento alle politiche ambientali (è considerata best in class, follower, etc., è presente in azienda un responsabile per le politiche aziendali? )[11]
A5 Considerazione attribuita alle politiche ambientali nei settori di produzione e progettazione
A6 Capacità di gestione, attraverso l’implementazione di strumenti di crisis management, delle tensioni in ambito ambientale.
A7 Nel trascorso recente dell’azienda, nei confronti di questo stakeholder, si sono verificate tensioni particolari?Per il conferimento del punteggio per questa domanda, fare riferimento alla legenda:
|
> 7 crisi negli ultimi 5 anni |
-2,00 |
|
Tra 7 e 4 crisi negli ultimi 5 anni |
-1,00 |
|
Tra 3 e 2 crisi negli ultimi 5 anni |
0 |
|
1 crisi negli ultimi 5 anni |
1,00 |
|
Nessuna crisi negli ultimi 5 anni |
2,00 |
B) Influenza dell’azienda sullo stakeholder
(asse verticale: influenzati/non influenzati dall’azienda).
B1 Utilizzo di soluzioni per la riduzione del consumo energetico e dell’acqua
B2 Utilizzo di fonti energetiche alternative
B3 Risparmio/Contenimento nell’utilizzo di materie prime
B4 Preferenza per materie naturali/riciclate/provenienti da fonti rinnovabili
B5 Riduzione/contenimento nel trattamento dei rifiuti (raccolta differenziata, smaltitori autorizzati)
B6 Riduzione degli imballaggi
B7 Uso di soluzioni per ridurre i consumi nel trasporto od il trasporto stesso
B8 Formazione del personale sulle tematiche ambientali (oltre gli obblighi di legge)
B9 Ricerca e sviluppo di prodotti ecocompatibili e di progetti produttivi più efficienti
B10 Compensazione delle emissioni (p.e. acquisto certificati verdi o altre misure compensative “impatto 0”)
B11 Adozione di sistemi di gestione ambientale certificati
B12 Sostegno a programmi/attività che si occupano di problematiche ambientali
C) Stakeholder engagement:
(Influenza dello stakeholder sull’azienda – parziale – e dimensione colore: catalogazione profilo di crisi)
C1 Report di sostenibilità ambientale
C2 Impegno nell’organizzazione di iniziative per la rendicontazione delle politiche ambientali. (eventi ad hoc, advertising, ufficio stampa, siti dedicati, etc.)
C3 Condivisione delle politiche ambientali aziendali con ONG impegnate nella tutela dell’ambiente e altri OL del settore.
C4 Partecipazione dei dipendenti alla definizione di standard ambientali aziendali
C5 Politiche di incentivo a comportamenti sostenibili virtuosi per i dipendenti in ambito lavorativo o/e nella vita privata
A) Influenza dello stakeholder sull’azienda
(asse orizzontale: influenti/ininfluenti per l’azienda)
A1 Presenza di rappresentanza sindacale in azienda e apertura alla “sindacalizzazione”.
A2 Preponderanza di forme contrattuali che garantiscono stabilità ai dipendenti rispetto al ricorso a lavoro interinale, a progetto, ed altri contratti atipici.
A3 “spazio di manovra” della direzione del personale (si occupa solo di stilare contratti e calcolare le buste paghe, o “entra nel merito”, gestendo programmi di formazione etc.).
A4 Considerazione dell’azienda in termini di politica del personale (può ritenersi una “best in class“, una “follower“, segue e riproduce best practice altrui, “indifferente”, “worst“,?13)
A5 Capacità di gestione, attraverso l’implementazione di strumenti di crisis management, delle tensioni nell’ambito dell’organizzazione del personale (p.e: vertenze, scioperi, piani di ristrutturazione con conseguenti esuberi, ricorso a cassa integrazione, denunce subite per licenziamenti senza giusta causa / mobbing /altro etc.)
A6 Nel trascorso recente dell’azienda, nei confronti di questo stakeholder, si sono verificate tensioni particolari?Per il conferimento del punteggio per questa domanda, fare riferimento alla legenda:
|
> 7 crisi negli ultimi 5 anni |
-2,00 |
|
Tra 7 e 4 crisi negli ultimi 5 anni |
-1,00 |
|
Tra 3 e 2 crisi negli ultimi 5 anni |
0 |
|
1 crisi negli ultimi 5 anni |
1,00 |
|
Nessuna crisi negli ultimi 5 anni |
2,00 |
B) Influenza dell’azienda sullo stakeholder
(asse verticale: influenzati/non influenzati dall’azienda).
B1 Adozione di sistemi di gestione (ad esempio, SA8000, OHSAS 18000) e/o standard nell’ambito dei diritti umani dei lavoratori.
B2 Attenzione alla salute e sicurezza (oltre la normativa ex – 626/94) e cura per l’ambiente di lavoro.
B3 Adeguatezza dei livelli retributivi alla valorizzazione delle competenze e incentivi alla produttività.
B4 Tutela della privacy (protezione dei dati sensibili) oltre gli obblighi di legge.
B5 Disponibilità alla flessibilità nell’orario di lavoro (riduzione degli straordinari, part-time su richiesta del lavoratore).
B6 Formazione e professionalizzazione degli addetti (inclusi corsi dedicati alla CSR, in materia di salute e sicurezza, ecc.).
B7 Offerta percorsi di carriera e sistemi di incentivazione oltre gli obblighi di legge.
B8 Esistenza di Programmi di inserimento dei neoassunti.
B9 Rispetto delle pari opportunità (p.e. donne in posizione di responsabilità e livelli retributivi pari ai colleghi maschi).
B10 Implementazione di interventi volti a favorire la conciliazione lavoro-famiglia (telelavoro, disponibilità di asilo nido, bonus maternità, prassi aziendali, ecc.).
B11 Implementazione di interventi che facilitino l’integrazione dei disabili (es. percorsi formativi ad hoc, inserimento di persone con disabilità anche se esonerati dagli obblighi di legge, ecc.).
B12 Implementazione di interventi che facilitino l’integrazione degli immigrati (es. corsi di lingua, fornitura alloggi o supporto per trovare casa).
B13 Agevolazioni per i dipendenti (ad esempio, assistenza sanitaria integrativa, fiscale, ecc.).
B14 Gestione partecipativa e mirata al coinvolgimento e all’autonomia dei collaboratori.
B15 Valorizzazione del lavoro di gruppo.
B16 Politiche/azioni per la tutela dei diritti dei lavoratori nei Paesi esteri.
B17 Azioni di ristrutturazione e riorganizzazione dell’azienda in un’ottica di responsabilità sociale.
C) Stakeholder engagement
(Influenza dello stakeholder sull’azienda – parziale – e dimensione colore: catalogazione profilo di crisi)
C1 Collaborazione della direzione del personale nella gestione delle pratiche con altre funzioni. (Board, staff CSR, etc.)
C2 Condivisione e co-progettazione delle pratiche con i lavoratori (consultazioni, interviste, incontri periodici, survey anonime, tavoli di confronto al di la delle relazioni sindacali previste dal contratto, focus group etc.)
C3 Presentazione delle pratiche sopra descritte nella rendicontazione sociale.
C4 Iniziative interattive di indagine sul “clima interno” e sulla soddisfazione del personale .
C5 Strumenti di Comunicazione interna che diano voce ai dipendenti (giornalino, bacheca, newsletter, ecc, riunioni periodiche)
A) Influenza dello stakeholder sull l’azienda
(asse orizzontale: influenti/ininfluenti per l’azienda)
A1 Attenzione al contenimento della rivendita pura di prodotti altrui (rispetto a quelli acquistati da terzisti o grossisti, ecc.)
A2 Preponderanza di fornitori per i quali l’azienda costituisce un cliente Primario, principale, prioritario o comunque rilevante nella percentuale del giro di affari.
A3 Implementazione di politiche di controllo anche sulla catena dei sub-fornitori.
A4 Considerazione dell’azienda in termini di qualità del rapporto con i fornitori (può ritenersi una “best in class”, un “follower”, segue e riproduce best practics altrui, “indifferente”, “worst” (additata all’opinione pubblica come esempio da NON seguire)[12]
A5 Capacità di gestione, attraverso l’implementazione di strumenti di crisis management, delle tensioni associate alla catena dei fornitori (p.e. in caso di rivendita di prodotti avariati o non conformi, denunce da parte di ONG e altro per pratiche scorrette nella supply chain, etc.)15
A6 Nel trascorso recente dell’azienda, nei confronti di questo stakeholder, si sono verificate tensioni particolari?Per il conferimento del punteggio per questa domanda, fare riferimento alla legenda:
|
> 7 crisi negli ultimi 5 anni |
-2,00 |
|
Tra 7 e 4 crisi negli ultimi 5 anni |
-1,00 |
|
Tra 3 e 2 crisi negli ultimi 5 anni |
0 |
|
1 crisi negli ultimi 5 anni |
1,00 |
|
Nessuna crisi negli ultimi 5 anni |
2,00 |
B) Influenza dell’azienda sullo stakeholder
(asse verticale: influenzati/non influenzati dall’azienda).
B1 Applicazione di politiche di selezione e gestione dei fornitori.
B2 Applicazione di criteri contrattuali trasparenti e collaborativi.
B3 Rispetto dei termini di pagamento.
B4 Adozione di criteri di selezione che valutano Il rispetto delle condizioni di salute dei lavoratori e di sicurezza del luogo di lavoro
B5 Adozione di criteri che valutino la messa in atto di comportamenti rispettosi dell’ambiente
B6 Adozione di criteri che valutino la messa in atto di comportamenti rispettosi dei fondamentali diritti umani e dei lavoratori (non ricorso al lavoro infantile, al lavoro forzato, assenza di condizioni di sfruttamento, libertà associazionismi sindacale, ecc)
B7 Richiesta di certificazione del prodotto/servizio
B8 Esistenza di strumenti di verifica dei processi produttivi
B9 Coinvolgimento e sensibilizzazione dei fornitori sulle tematiche della responsabilità sociale
B10 Adozione di un sistema di gestione dei fornitori certificato (SA8000)
B11 Adozione di standard nell’ambito della catena di fornitura (linee guida OCSE, ecc.)
B12 Adozione di un codice etico per i fornitori, p.e “Carta etica dei Fornitori”
C) Stakeholder engagement
(Influenza dello stakeholder sull’azienda – parziale – e dimensione colore: catalogazione profilo di crisi)
C1 Ricorso a servizi di consulenza per l’implementazione del profilo etico e qualitativo dei fornitori
C2 Disponibilità nell’offerta di Servizi di credito o altre agevolazioni finanziarie per i fornitori cruciali in temporanee difficoltà
C3 Compartecipazione societaria, co-branding, progettazione congiunta e altre forme di integrazione orizzontale e (anche strategica) nella supply chain.
C4 Condivisione e gestione delle politiche di protezione brevettuali (licensing, etc.):
C5 Partecipazione all’innovazione sviluppata in azienda da parte dei fornitori.
C6 Partecipazione congiunta di fornitori e aziende a fiere, convegni nel settore merceologico etc.
C7 Presenza congiunta di fornitori e azienda in associazioni di categoria e altri tavoli istituzionali (p. es.: Associazioni che comprendano produttori di semilavorati e assemblatori nella stessa categoria merceologica , o azienda e fornitori che rientrino entrambe nel settore “chimico” etc.)
C8 Adesione da parte dell’ azienda a Incontri, focus group e altri momenti di condivisine di strategie e confronti non esclusivamente “product oriented”.
C9 Frequenza di Iniziative congiunte da parte di azienda e fornitore per l’engagement (formazione, volontariato aziendale etc.) con i rispettivi dipendenti.
C10 Presenza di “release” privilegiate nei report aziendali (economici, di mercato e sociali) per i fornitori chiave.
C11 Presentazione delle pratiche nel bilancio sociale.
A) Influenza dello stakeholder sull’ azienda
(asse orizzontale: influenti/ininfluenti per l’azienda)
A1 Sviluppo di studi interni sulla customer satisfaction.
A2 Implementazione di strumenti di controllo e di verifica sui canali di vendita, delle attività relazionali con il pubblico, della gestione delle relazioni con il cliente prima della vendita (promozione, agenti), durante la vendita (canali di vendita: negozi, shop, canali telefonici, ecommerce etc.) post vendita (assistenza, follow up, crm etc.).
A3 Organizzazione di iniziative di audit sulla rete commerciale e/o retailers per analisi risultati circa soddisfazione e percezione della clientela, richieste, criticità etc.
A4 Considerazione dell’azienda in termini di qualità del rapporto con la clientela (può ritenersi una “best in class”, un “follower”, segue e riproduce best practice altrui, “indifferente”, “worst”[13], esiste un responsabile delle relazioni con la clientela?)
A5 Capacità di gestione, attraverso l’implementazione di strumenti di crisis management, di tensioni associate a questo stakeholder.
A6 Nel trascorso recente dell’azienda, nei confronti di questo stakeholder, si sono verificate tensioni particolari?Per il conferimento del punteggio per questa domanda, fare riferimento alla legenda:
|
> 7 crisi negli ultimi 5 anni |
-2,00 |
|
Tra 7 e 4 crisi negli ultimi 5 anni |
-1,00 |
|
Tra 3 e 2 crisi negli ultimi 5 anni |
0 |
|
1 crisi negli ultimi 5 anni |
1,00 |
|
Nessuna crisi negli ultimi 5 anni |
2,00 |
B) Influenza dell’azienda sullo stakeholder
(asse verticale: influenzati/non influenzati dall’azienda).
B1 Adozione Certificazioni di qualità (ISO9000, certificazioni prodotto. etc.)
B2 Adozione Marchi sulla sicurezza del prodotto
B3 Adozione Marchi ed etichettature ecologiche
B4 Comunicazione e documentazione delle certificazioni di qualità
B5 Comunicazione Etichettatura o certificazione sociale
B6 Somministrazione di Informazioni volontarie sul prodotto/servizio offerto in termini di garanzia di qualità, sicurezza, eticità, impatto ambientale (ad esempio, informazioni dettagliate sulla provenienza, tracciabilità di prodotto, etichettatura, bollini, ISO22000, ecc.)
B7 Comunicazione di dichiarazioni spontanee sui processi produttivi utilizzati.
C) Stakeholder engagement
(Influenza dello stakeholder sull’azienda – parziale – e dimensione colore: catalogazione profilo di crisi)
C1 CRM focalizzato sulla percezione e discussione dei prodotti
C2 Coinvolgimento dei clienti nella creazione e progettazione di nuovi prodotti (vedi il caso Ducati, che si definisce una Stakeholder company, di proprietà – di fatto – dei propri “fans”)
C3 Partecipazione a brand community, online o con eventi specifici (inaugurazioni, temporary shop, mostre, etc.)
C4 Organizzazione e partecipazione ad Attività di education per un corretto utilizzo dei prodotti, contro lo spreco di risorse e materie prime, sull’eticità della provenienza delle medesime etc. (vedi campagna contro l’acqua in bottiglia di COOP)
C5 Adesione di politiche di pricing condiviso, gamme di prodotti a prezzo calmierato (vedi “il pane a 1€/Kg di COOP)
C6 Comunicazione e rendicontazione delle attività rivolte al pubblico dei clienti attraverso i canali istituzionali ed il bilancio sociale).
A) Influenza dello stakeholder sull’ azienda
(asse orizzontale: influenti/ininfluenti per l’azienda)
A1 Applicazioni delle politiche di CSR alle iniziative sociali a favore delle comunità dove è inserita l’azienda.
A2 Attenzione dedicata dall’azienda all’impegno sociale.
A3 Partecipazione diretta e personale dell’imprenditore alle iniziative sociali.
A4 Considerazione dell’azienda in termini di impegno per la comunità sociale (può ritenersi una “best in class“, una “follower“, segue e riproduce best practice altrui, “indifferente”, “worst“, esiste un responsabile delle iniziative sociali per la comunità?).
A5 Attenzione all’impatto sociale nella pianificazione delle strategie economiche aziendali.
A6 Gestione, attraverso l’implementazione di strumenti di crisis management, delle tensioni associate a questo stakeholder.
A7 Nel trascorso recente dell’azienda, nei confronti di questo stakeholder, si sono verificate tensioni particolari? Per il conferimento del punteggio per questa domanda, fare riferimento alla legenda:
|
> 7 crisi negli ultimi 5 anni |
-2,00 |
|
Tra 7 e 4 crisi negli ultimi 5 anni |
-1,00 |
|
Tra 3 e 2 crisi negli ultimi 5 anni |
0 |
|
1 crisi negli ultimi 5 anni |
1,00 |
|
Nessuna crisi negli ultimi 5 anni |
2,00 |
B) Influenza dell’azienda sullo stakeholder
(asse verticale: influenzati/non influenzati dall’azienda
B1 Donazioni e liberalità a favore di organizzazioni ed iniziative sociali.
B2 Sostegno ad attività culturali.
B3 Sostegno ad attività sportive e/o ad attività ricreative.
B4 Sostegno ad attività che si occupano della difesa dei diritti umani (diritti politici, sfruttamento lavoro minorile, lotta alla prostituzione….).
B5 Sostegno a programmi/attività che si occupano di problematiche ambientali.
B6 Sostegno di iniziative nell’ambito della cooperazione internazionale.
B7 Sostegno di iniziative di assistenza a favore dei disabili, malati, poveri, detenuti, comunità di recupero o altri soggetti in situazione di disagio.
B8 Sostegno a programmi di ricerca (cancro, malattie particolari…).
B9 Istituzione di borse di studio/premi.
B10 Sostegno di progetti a favore di studenti in collaborazione con scuole od istituti.
B11 Sostegno (anche in forma di partnership) di programmi di formazione professionale complementare o partecipazione in iniziative di sostegno al proprio settore produttivo.
B12 Partecipazione a progetti territoriali per la crescita occupazionale e lo sviluppo economico sociale culturale della propria comunità di riferimento.
B13 Volontariato d’impresa
B14 Donazioni in denaro oppure in natura di macchinari/attrezzature/ prodotti nuovi o usati o in esubero.
B15 Messa a disposizione gratuita di locali, attrezzature o di materiale.
B16 Partecipazione diretta dei dipendenti alle iniziative sociali.
B17 Campagne di promozione di prodotti/servizi a sostegno di una causa sociale (Cause- related marketing).
C) Stakeholder engagement
(Influenza dello stakeholder sull’azienda – parziale – e dimensione colore: catalogazione profilo di crisi)
C1 Esistenza di linee guida per la disposizione del budget sociale.
C2 Pubblicazione delle linee guida per i richiedenti sostegno economico.
C3 Pubblicazione di bandi periodici/a scadenza/aperti.
C4 Rendicontazione dei progetti sostenuti.
C5 Diffusione e promozione dei risultati dei progetti.
C6 Presentazione delle best practice nel bilancio sociale aziendale e/o altre forme di rendicontazione.
C7 Strumenti di analisi della distribuzione del valore in allegato al bilancio aziendale.
C8 Convocazione di focus groups, briefing o altre forme di partecipazione e condivisione con le realtà sociali.
A) Influenza dello stakeholder sull’azienda
(asse orizzontale: influenti/ininfluenti per l’azienda)
A1 Capacità di gestione, attraverso l’implementazione di strumenti di crisis management, delle tensioni nei confronti di questo stakeholder.
A2 Nel trascorso recente dell’azienda, nei confronti di questo stakeholder, si sono verificate tensioni particolari?Per il conferimento del punteggio per questa domanda, fare riferimento alla seguente legenda:
|
> 7 crisi negli ultimi 5 anni |
-2,00 |
|
Tra 7 e 4 crisi negli ultimi 5 anni |
-1,00 |
|
Tra 3 e 2 crisi negli ultimi 5 anni |
0 |
|
1 crisi negli ultimi 5 anni |
1,00 |
|
Nessuna crisi negli ultimi 5 anni |
2,00 |
A3 Presenza sui media, numero uscite (Analisi quantitativa e qualitativa)
A4 Considerazione dell’azienda in termini di qualità del rapporto con l’opinione pubblica (è considerata best in class, follower, segue e riproduce best practice altrui, worst, è presente in azienda un responsabile per l’ opinione pubblica, giornalisti e media? )[14]
B) Influenza dell’azienda sullo stakeholder
(asse verticale: influenzati/non influenzati dall’azienda).
B1 Grado di attività dell’ ufficio stampa (segnalare se é interno o esterno all’azienda)
B2 Grado di collaborazione tra ufficio stampa e le diverse aree aziendali per la comunicazione all’esterno (segnalare se sono previste linee diverse per la comunicazione commerciale, istituzionale, delle attività di CSR, etc.)
B3 Partecipazione dell’azienda a convegni, seminari etc. nel settore merceologico.
B4 Partecipazione dell’azienda a convegni/seminari/incontri nell’ambito dell’evoluzione della cultura di impresa.
B5 Richiesta di citazione dell’azienda in tesi, studi, ricerche.
B6 Disponibilità e supporto da parte dell’azienda a ricercatori e studenti che intendano analizzare casi di studio inerenti l’azienda o i suoi ambiti di interesse per sondaggi, ricerche, tesi e studi.
B7 Partecipazione a mostre, fiere, eventi culturali non necessariamente finalizzati alla promozione commerciale, ma di taglio “informativo” e culturale.
B8 Sponsorizzazione degli eventi sopra elencati oltre che partecipazione alla preparazione e diffusione dei contenuti.
B9 Comunicazione sociale e ambientale.
B10 Dialogo con le associazioni dei consumatori.
B11 Realizzazione di indagini periodiche sui bisogni dei clienti e livello della customer satisfaction.
B12 Ricerca e sviluppo di nuovi prodotti/servizi in risposta alle esigenze della clientela (capacità di rinnovo e miglioramento continuo).
C) Stakeholder engagement
(Influenza dello stakeholder sull’azienda – parziale – e dimensione colore: catalogazione profilo di crisi)
C1 Proattività dell’azienda nell’organizzazione di eventi culturali (seminari, studi, corsi in università o presso altre istituzioni e organizzazioni culturali), e supporto all’attività di “think tank” nel settore di pertinenza.
C2 Esistenza di focus groups di giornalisti e/o opinion leader in fase di implementazione di strategie di comunicazione.
C3 Coinvolgimento dei giornalisti a periodici “briefing” e altre attività relazionali ristrette.
C4 Dotazione di una crisis room in azienda, con focus sulla gestione di casi di crisi comunicazionale.
C6 Presenza e training della crisis room comunicazionale.
C7 Utilizzo frequente e periodico di canali di comunicazione “2.0” nel dialogo con l’opinione pubblica. (p.e: l’azienda partecipa a dibattiti online su blog e forum etc. su argomenti che la riguardano?)
C8 Adozione di altre politiche di incentive e di coinvolgimento di giornalisti e comunicatori.
C9 Monitoraggio, misurazione e rendicontazione dell’attività di informazione.
C10 Presenza in azienda di una divisione editoriale o comunque di un’attività divulgativa aziendale.
C11 Reportistica di queste attività sul bilancio sociale, e / o in altre forme di report al pubblico.
A) Influenza dello stakeholder sull’azienda
(asse orizzontale: influenti/ininfluenti per l’azienda)
A1 Frequenza ed efficienza delle analisi dei rapporti economici e finanziari esistenti
A2 Solidità delle relazioni con banche e creditori (presentare in allegato abstract sulle analisi delle figure preposte alla relazione con la comunità finanziaria, al mandato ed autonomia di queste figure).
A3 Reportistica agli azionisti, al di là delle normali comunicazioni previste dal diritto societario.
A4 Grado di partecipazione alle assemblee degli azionisti.
A5 Grado di coinvolgimento e arricchimento per i manager al di là degli argomenti di natura strettamente statutaria nell’ambito delle assemblee degli azionisti.
A6 Importanza attribuita alle performance aziendali: focus sulle trimestrali di cassa o sul raggiungimento degli obiettivi di piani industriali a medio termine. Analisi del turn-over del management e delle motivazioni del medesimo.
A7 Analisi del modello di governance interna.
A8 Nel trascorso recente dell’azienda, nei confronti di questo stakeholder, si sono verificate tensioni particolari?Per il conferimento del punteggio per questa domanda, fare riferimento alla seguente legenda:
|
> 7 crisi negli ultimi 5 anni |
-2,00 |
|
Tra 7 e 4 crisi negli ultimi 5 anni |
-1,00 |
|
Tra 3 e 2 crisi negli ultimi 5 anni |
0 |
|
1 crisi negli ultimi 5 anni |
1,00 |
|
Nessuna crisi negli ultimi 5 anni |
2,00 |
A9 Capacità di gestione, attraverso l’implementazione di strumenti di crisis management, delle tensioni nei confronti di questo stakeholder.
B) Influenza dell’azienda sullo stakeholder
(asse verticale: influenzati/non influenzati dall’azienda).
B1 Attività di relazioni pubbliche verso il mondo finanziario.
B2 Periodicità ed enfasi con cui vengono rilasciati report sull’andamento dell’azienda e performance finanziarie.
B3 Indipendenza e obiettività dell’ente certificatore dei bilanci e di altri indicatori finanziari.
B4 Adozione di strumenti di controllo incrociato.
B5 Predisposizione di figure manageriali alla diffusione della conoscenza dei piani industriali a medio periodo.
B6 Rispetto da parte dei manager – e nei confronti della comunità finanziaria – dei milestones previsti nei piani industriali.
B7 Esistenza e diffusione di un codice etico o una carta della governance aziendale all’interno ed all’esterno dell’azienda.
B8 Rispetto del codice etico/carta della governante aziendale.
B9 Delega ad un ente certificatore esterno della verifica del rispetto dello strumento.
B10 E sistenza di altri strumenti di trasparenza nell’informazione sulla performance finanziaria.
C) Stakeholder engagement
(Influenza dello stakeholder sull’azienda – parziale – e dimensione colore: catalogazione profilo di crisi)
C1 Presenza e training di una crisis room con focus sull’andamento degli indicatori finanziari
C2 Adozione di politiche di relazione con il mondo finanziario al di là delle normali comunicazioni previste dal diritto vigente.
C3 Coinvolgimento periodico di banche, investitori, istituzioni finanziarie e di controllo in incontri, briefing, release, focus.
C4 Condivisione e discussione dei piani finanziari a breve termine, e i piani industriali a medio, con focus groups rappresentativi della comunità finanziaria.
C5 Coinvolgimento di azionisti, creditori, investitori in periodici aggiornamenti delle carte etiche sulla governance aziendale.
C6 Verifica sul rispetto delle carte etiche sulla governance aziendale.
C7 Livello di diffusione della reportistica economica finanziaria dell’azienda. (Il bilancio viene pubblicato sul sito, promosso con campagne inserzionistiche, viene declinato in versioni ridotte e sintetiche per il grande pubblico, viene presentato e esplicitato nel dettaglio in eventi ad hoc, o altre occasioni di incontro degli operatori del settore?Segnalare modalità diffusione).
A) Influenza dello stakeholder sull’azienda
(asse orizzontale: influenti/ininfluenti per l’azienda)
A1 Dipendenza dell’azienda da interventi legislativi nel settore merceologico di riferimento o da vincoli normativi particolari (p.es. nel caso del settore pharma o food per la tutela dei consumatori o import-export di materie “sensibili” come il petrolio o l’uranio, o attività finanziarie, assicurative etc. con forte presenza di appositi organismi di controllo pubblico a livello nazionale o internazionale).
A2 Presenza di riforme o altri importanti interventi normativi e/o regolatori negli ultimi anni.
A3 Dipendenza del settore merceologico da una sorta di “mercato bloccato” (municipalizzate, settore collettivizzato, etc?)
A4 Liberalizzazione o esistenza di altri interventi strutturali nel comparto.
A5 Rilevanza o prevalenza dell’ operare dell’ azienda con il settore pubblico, fornitura di servizi e prodotti a supporto o in convenzione con il comparto pubblico (p. es.: riscossione di tasse e tributi, o settore medico in convenzione con il SSN, o concessione di autostrade o altre infrastrutture, etc.).
NB: Questa analisi è volta a comprendere in quanta parte la business continuity stessa sia soggetta a variabili di tipo normativo o regolatorio, con conseguente influenza degli organismi preposti sull’esistenza stessa del’azienda.
A6 Capacità di gestione, attraverso l’implementazione di strumenti di crisis management, delle tensioni nei confronti di questo stakeholder.
A7 Considerazione dell’azienda in termini di qualità del rapporto con questo stakeholder (è considerata best in class, follower, segue e riproduce best practice altrui, worst, è presente in azienda un responsabile delle relazioni con questo stakeholder? )[15]
A8 Nel trascorso recente dell’azienda, nei confronti di questo stakeholder, si sono verificate tensioni particolari?Per il conferimento del punteggio per questa domanda, fare riferimento alla seguente legenda:
|
> 7 crisi negli ultimi 5 anni |
-2,00 |
|
Tra 7 e 4 crisi negli ultimi 5 anni |
-1,00 |
|
Tra 3 e 2 crisi negli ultimi 5 anni |
0 |
|
1 crisi negli ultimi 5 anni |
1,00 |
|
Nessuna crisi negli ultimi 5 anni |
2,00 |
B) Influenza dell’azienda sullo stakeholder
(asse verticale: influenzati/non influenzati dall’azienda).
B1 Adozione in azienda di una linea di relazioni istituzionali dedicata (segnalare chi tiene le relazioni con le istituzioni di riferimento).
B2 Adozione di linea di relazioni istituzionali generica verso il mondo della politica, locale o nazionale.
B3 Gestione interna di queste relazioni (segnalare se invece viene gestita con il supporto di agenzie di PR e Lobby specialistiche).
B4 Partecipazione a tavoli congiunti con le istituzioni o con altri attori del settore o comparto merceologico.
B5 Ruolo attivo nelle organizzazioni di settore, o datoriali, o in altre organizzazioni di imprese.
B6 Partecipazione ad eventi, manifestazioni, studi, ricerche e altre attività inerenti la cultura di impresa nel settore, con compartecipazione di enti pubblici di riferimento.
B7 Attività di media relation a supporto delle rivendicazioni del settore versus le istituzioni.
B8 Carta etica interna all’azienda che vieti espressamente attività di condizionamento occulto per i politici o rappresentanti istituzionali di riferimento.
B9 Carta etica interna che imponga criteri di trasparenza nelle attività di lobby.
B10 Attività di coinvolgimento, briefing periodici, partecipazione a trasmissioni e altri dibattiti pubblici in materia.
C) Stakeholder engagement
(Influenza dello stakeholder sull’azienda – parziale – e dimensione colore: catalogazione profilo di crisi)
C1 Partecipazione ad attività di proposta di riforma normativa nel settore.
C2 Partecipazione a tavoli interistituzionali, con oggetto la normativa di settore.
C3 Attività di sensibilizzazione pubblica (sui media) circa necessità normative nel settore.
C4 Supporto attivo (anche sponsorizzazioni) ad associazioni di consumatori attive nel comparto merceologico di competenza.
C5 Rendicontazione delle attività di lobbyng, alla comunità dei media e inserimento delle medesime nelle linee di rendicontazione sociale.
A) Influenza dello stakeholder sull’azienda
(asse orizzontale: influenti/ininfluenti per l’azienda)
A1 Iscrizione dell’azienda a associazioni di categoria datoriale.
A2 Iscrizione dell’azienda ad associazioni di categoria di comparto.
A3 Rilevanza nella storia recente nell’ambito del settore della capacità di innovazione tecnica o di processo delle associazioni o dei competitors.
A4 Rilevanza nell’ambito del settore della capacità di innovazione normativa o di processo delle associazioni o dei competitors.
A5 Tranquillità dei rapporti con i competitors di riferimento (o esistono, nella storia recente, casi di aperta polemica o di “scontro” mediatico su particolari questioni?).
A6 Analisi comparativa del profilo reputazionale del brand e dell’azienda con relativi principali competitors
A7 Frequenza di attività di sondaggio e monitoraggio per l’andamento del comparto, e per l’individuazione precoce di nuovi trend o innovazioni che possano essere cavalcate o promosse da competitors inusuali? (vedi p. es. l’avvento delle “low cost” nel comparto del trasporto aereo”).
A8 Capacità di gestione, attraverso l’implementazione di strumenti di crisis management, delle tensioni nei confronti di questo stakeholder.
A9 Nel trascorso recente dell’azienda, nei confronti di questo stakeholder, si sono verificate tensioni particolari?Per il conferimento del punteggio per questa domanda, fare riferimento alla seguente legenda:
|
> 7 crisi negli ultimi 5 anni |
-2,00 |
|
Tra 7 e 4 crisi negli ultimi 5 anni |
-1,00 |
|
Tra 3 e 2 crisi negli ultimi 5 anni |
0 |
|
1 crisi negli ultimi 5 anni |
1,00 |
|
Nessuna crisi negli ultimi 5 anni |
2,00 |
B) Influenza dell’azienda sullo stakeholder
(asse verticale: influenzati/non influenzati dall’azienda).
B1 Partecipazione attiva dell’azienda ai lavori delle associazioni datoriali e di comparto.
B2 Disposizione di seggi in ruoli rappresentativi o esecutivi.
B3 Adozione di politiche ed attività di lobby congiunte con le associazioni di comparto.
B4 Esistenza di attività di informazione e sensibilizzazione al pubblico – su materie relative al comparto di appartenenza – congiuntamente con associazioni di comparto o competitors.
B5 Esistenza di attività congiunte in collaborazione con università e o altri istituti di ricerca per lo sviluppo tecnologico del settore.
B6 Presenza in azienda di figure specifiche preposte al raccordo e coordinamento con i competitors.
C) Stakeholder engagement
(Influenza dello stakeholder sull’azienda – parziale – e dimensione colore: catalogazione profilo di crisi)
C1 Attività di focus groups o attività di audit, consultazione etc. per la valutazione di strategie congiunte di comunicazione, di lobby o di implementazione di processi e prodotti nel comparto.
C2 Attività di “restituzione” o condivisione circa i progressi conseguiti nella ricerca e sviluppo, in favore della comunità degli addetti ai lavori e degli stessi competitors.
C3 Adozione di politiche di disclosure o di anticipazione circa le release di mercato.
10) Territorio
A) Influenza dello stakeholder sull’azienda
(asse orizzontale: influenti/ininfluenti per l’azienda)
A1 Nel trascorso recente dell’azienda, nei confronti di questo stakeholder, si sono verificate tensioni particolari (relative ai rapporti con i residenti o le comunità locali) Per il conferimento del punteggio per questa domanda, fare riferimento alla seguente legenda:
|
> 7 crisi negli ultimi 5 anni |
-2,00 |
|
Tra 7 e 4 crisi negli ultimi 5 anni |
-1,00 |
|
Tra 3 e 2 crisi negli ultimi 5 anni |
0 |
|
1 crisi negli ultimi 5 anni |
1,00 |
|
Nessuna crisi negli ultimi 5 anni |
2,00 |
A2 Considerazione dell’azienda nella comunità di riferimento.
A3 Capacità di gestione, attraverso l’implementazione di strumenti di crisis management, delle tensioni nei confronti di questo stakeholder.
A4 Considerazione dell’azienda in termini di qualità del rapporto con questo stakeholder (è considerata best in class, follower, segue e riproduce best practice altrui, worst, è presente in azienda un responsabile delle relazioni con questo stakeholder? )[16]
B) Influenza dell’azienda sullo stakeholder
(asse verticale: influenzati/non influenzati dall’azienda).
B1 Esistenza di unità preposte alle media relations e alle public relations dedicate alle realtà locali. (media locali o di quartiere, istituzioni locali etc.)
B2 Esistenza di figure interne all’ azienda, dedicate ai rapporti con il territorio sia dove è collocata la sede che dove sono collocate le sue filiali.
B3 Sponsorizzazione o altre forme di partecipazione dell’azienda a eventi culturali, sportivi, folcloristici etc. che si tengono nell’area dove è collocata l’azienda.
B4 Concessione o condivisione di spazi e o risorse aziendali in occasione di manifestazioni o iniziative promosse dal territorio (p. es. concerti, corsi, momenti di formazione, convegni etc.)
B5 Promozione di Giornate “a porte aperte” in cui l’azienda incontra il pubblico locale e si fa conoscere e visitare.
B6 Disponibilità a visite scolastiche guidate e altre forme di educational verso i più piccoli.
B7 Collaborazioni (sponsorizzazioni) con le istituzioni sanitarie, educative, culturali etc. nell’area in cui è collocata l’azienda.
C) Stakeholder engagement
(Influenza dello stakeholder sull’azienda – parziale – e dimensione colore: catalogazione profilo di crisi)
C1 Disponibilità all’incontro con i rappresentanti locali, associazioni del territorio, amministratori, cittadinanza.
C2 Focus group per la disclosure, o discussione partecipata di piani industriali, di sviluppo etc.
C3 Partecipazione dell’azienda a piani locali di sviluppo o altre forme di investimento sul territorio
C4 Partecipazione – o promozione qualora non siano previsti, di tavoli di confronto per la pianificazione condivisa con gli amministratori locali
C5 Rendicontazione delle attività e relazioni sul bilancio sociale.
C6 Divulgazione del bilancio sociale in ambito territoriale.
Divulgazione del bilancio sociale in ambito territoriale.
A) Influenza dello stakeholder sull’azienda
(asse orizzontale: influenti/ininfluenti per l’azienda)
A1 Importanza attribuita allo stakeholder da parte dell’azienda in base ad approfondito audit del reparto marketing o altri settori coinvolti in relazione diretta con questo stakeholder.
A2 Nel trascorso recente dell’azienda, nei confronti di questo stakeholder, si sono verificate tensioni particolari?Per il conferimento del punteggio di questa domanda, fare riferimento alla legenda:
|
> 7 crisi negli ultimi 5 anni |
-2,00 |
|
Tra 7 e 4 crisi negli ultimi 5 anni |
-1,00 |
|
Tra 3 e 2 crisi negli ultimi 5 anni |
0 |
|
1 crisi negli ultimi 5 anni |
1,00 |
|
Nessuna crisi negli ultimi 5 anni |
2,00 |
A3 Preponderanza di fornitori per i quali l’azienda costituisce un cliente Primario, principale, prioritario o comunque rilevante nella percentuale del giro di affari.
A4 Solidità del rapporto con i rivenditori strategici (a partire da audit su storia, durata e qualità del rapporto con essi, allegare documentazione di riferimento).
A5 Capacità di gestione, attraverso l’implementazione di strumenti di crisis management delle tensioni associate a questo stakeholder.
A5 Considerazione dell’azienda in termini di qualità del rapporto con questo stakeholder (è considerata best in class, follower, segue e riproduce best practice altrui, worst, è presente in azienda un responsabile delle relazioni con questo stakeholder? )[17]
B) Influenza dell’azienda sullo stakeholder
(asse verticale: influenzati/non influenzati dall’azienda).
B1 Adozione di politiche di pricing che rispettino i piccoli rivenditori (pensare in particolare al rapporto con quelli strategici per ragioni geografiche o di qualità di approccio – o questi vengono “cannibalizzati” e “bypassati” in favore dei grandi stores, i quali garantiscono però ingenti volumi di vendite?
B2 Esistenza di forme di tutela e compensazione dei piccoli rivenditori.
B3 Implementazione di politiche di selezione e gestione dei rivenditori.
B4 Trasparenza nei criteri contrattuali.
B5 Rispetto dei termini di pagamento.
B6 Applicazione dei criteri del codice etico aziendale anche ai rivenditori.
B7 Attività promozionali a supporto dei rivenditori.
B8 Comunicazione “below the line”.
B9 Premi e incentivi che riguardino anche gli aspetti qualitativi e non solo i volumi di vendita.
C) Stakeholder engagement
(Influenza dello stakeholder sull’azienda – parziale – e dimensione colore: catalogazione profilo di crisi)
C1 Partecipazione attiva alle politiche di Brand promotion, alla Brand community, agli eventi etc.
C2 Servizi di consulenza per l’implementazione del profilo etico e qualitativo.
C3 Servizi di credito o altre agevolazioni finanziarie per i rivenditori cruciali in situazioni di temporanea difficoltà.
C4 Compartecipazione societaria/co-branding/altre forme di integrazione orizzontale (anche strategica e societaria) con rivenditori e distributori.
C5 Altre forme di partnership (p. es.: progettazione congiunta o comunque co-partecipata di prodotti brand, innovazione e sviluppo, piattaforme informatiche condivise etc.)
C6 Grado di partecipazione all’innovazione sviluppata all’interno dell’azienda attraverso l’analisi delle politiche di condivisione e gestione delle protezioni brevettuali (licensing, etc.): a partire dalla definizione di punteggio “basso” in su, segnalare sul form a pag ? se viene tratto profitto da questa partecipazione C7 Partecipazione congiunta a fiere, convegni nel settore merceologico etc.
C8 Incontri, focus group e altri momenti di condivisione di strategie e confronti non esclusivamente “product oriented”.
C9 Iniziative congiunte per l’engagement (formazione, volontariato aziendale etc.) dei rispettivi dipendenti.
C10 Predisposizione di “release” privilegiate nei report aziendali (economici, di mercato e sociali) per i rivenditori chiave.
C11 Pubblicazione sul bilancio sociale del resoconto/certificazione delle best practice associate a questo stakeholder.
Le opere citate nel capitolo di questo saggio dal titolo “Le reti neurali complesse” sono “A logical calculus of the ideas immanent in nervous activity” (W. S. Mc Culloch e W. Pitts, primi anni ’40), “The organization of behavior” (D. O. Hebb, fine anni ‘40) e “Phychological review” (F. Rosenblatt, fine anni ’50).
Ecco una breve bibliografia su questi temi:
– Fabbri, Giampiero e Orsini, Raimondello – “Reti neurali per le scienze economiche”, Franco Muzzio editore
– Floreano D. e Mattiussi C. – “Manuale sulle reti neurali”, Bologna, Il Mulino
– Gerla, Giangiacomo – “Logica fuzzy e paradossi”, Lettera Matematica Pristem
– Gerla, Giangiacomo – “Fuzzy logic: mathematical tools for approximate reasoning”, Dordrecht, Kluwer Academic Publishers
– Guanrong, Chen e Trung, Tat Pham – “Introduction to Fuzzy Sets, Fuzzy Logic, and Fuzzy Control systems”, Lincoln, CRC Press
– Hájek, Peter – “Mathematics of Fuzzy logic”, Dordrecht, Kluwer Academic Publishers
– Hans-Jurgen Zimmermann, “Fuzzy Set theory and its applications”, Dordrecht, Kluwer Academic Publishers
– Jiri Klir, Gorge, Ute Saint Clair, Yuan, Bo – “Set Theory foundations and applications”, Upper Saddle River (New Jersey), Prentice Hall
– Jiri Klir, Gorge, e Yuan, Bo – “Fuzzy Sets and Fuzzy Logic – Theory and Applications”, Upper Saddle River (New Jersey), Prentice Hall
– Kosko, Bart – “Il fuzzy-pensiero. Teoria e applicazioni della logica fuzzy”, Baldini & Castoldi, 2002
– Kosko, Bart e Satoru Isaka – “Logica sfumata”, Le Scienze
– Leonardo, Roberto, Cignoli, Oscar e Mundici, Daniele – “Algebric Foundations of Many-valued Reasoning”, Dordrecht, Kluwer Academic Publishers
– Mendel, Jerry – “Uncertain rule-based Fuzzy logic systems: introduction and new directions”, Upper Saddle River, Prentice Hall (New Jersey)
– Mendelson, Elliott – “Introduzione alla logica matematica”, Torino, Bollati Boringhieri
– Meraviglia C. – “Le reti neurali nella ricerca sociale”, Bologna, Il Mulino
– Patarnello S. – “Le reti neuronali”, Franco Angeli
– Pessa E. – “Statistica con le reti neurali”, Roma, Di Renzo Editore
– Poma, L. – “Human Social Responsibility: una nuova prospettiva per la CSR. I rapporti della Corporate Social Responsibility con le neuroscienze e la biopsicologia”, Ferpi News, dicembre 2010
– Poma, L. – “Teoria dell entropia’: comunicazione di crisi e rapporti con la CSR”, Ferpi News, gennaio 2011
– Russo, Marco e Lakhmi, Jain – “Fuzzy learning and applications”, Boca Raton, CRC Press
– Ross, Timothy – “Fuzzy Logic with engineering applications”, Chichester (Regno Unito), John Wiley & Sons
– Wikipedia Free Enciclopedia on-line – “Fuzzy Logic” (UK) e “Reti neurali” (IT)
– Zadeh, Lotfi Asker – “Fuzzy algorithms information and control” e “Fuzzy sets information and control”
[1] Illustro meglio questo concetto in un paper pubblicato da Ferpi nel 1° numero de “I quaderni delle RP”, dal titolo “Siamo tutti stakeholder…ma…? “, corredato da un’adeguata bibliografia a sostegno di queste tesi
[2] questo concetto è sviluppato nel saggio “Teoria dell entropia’: comunicazione di crisi e rapporti con la CSR”, pubblicato su Ferpi News in gennaio 2011, e ribadisce quindi il rapporto di “dipendenza” che lega il Crisis Management e la Crisis Communication alla CSR
[3] si veda come esempio la mappa degli stakeholder pubblicata sul bilancio sociale di GUNA S.p.a., alla URL www.guna.it/bilanciosociale2009, pagg. 20 e seguenti
[4] il metodo sul quale relaziono in questo articolo è stato oggetto della tesi di Master della SDA Bocconi “Gestione dell’impresa sociale, non-profit e cooperativa”(dicembre 2010), a firma della tesista Dott. sa Francesca Delpiano, che ha anche fattivamente contribuito in staff con Luca Yuri Toselli al perfezionamento del metodo stesso, e che con l’occasione ringrazio
[5] la bozza di questionario riportato, tiene conto a titolo esemplificativo solo dei primi 5 stakeholder per i quali – in fase iniziale di sperimentazione del metodo – sono state elaborate le checklist
[6] la classificazione delle fasi di sviluppo è tratta da “Fasi dell’apprendimento conoscitivo – Manuale dello stakeholder Engagement” – Vol.2, Accountability – United Nations Environment Program, Stakeholder Research Associates (2005).
[8] potete contattarmi alle caselle e-mail lucapoma@lucapoma.info oppure staff@lucapoma.info
[9] uno dei “padri” delle RP italiane, Past-President della Federazione Relazioni Pubbliche Italiana, esperto di relazioni pubbliche di livello internazionale, Past President della Global Alliance for Public Relations and Communication Management e attualmente consigliere speciale del Presidente, Docente di Global Relations and Intercultural Communication alla New York University e Docente di Relazioni Pubbliche alla Università LUMSA di Roma
[10]Guna S.p.A., bilancio sociale 2010 (in fase di condivisione, chiusura prevista per fine giugno 2011) all’indirizzo www.guna.it/letueidee , e bilancio sociale 2011 (in fase di condivisione a partire dall’inizio di luglio 2011) www.guna.it/webcam
[11]Per questa domanda possono essere utilizzati parametri come l’attinenza alla GRI, più un’analisi della rassegna stampa aziendale, rassegna stampa del settore di pertinenza, partecipazione a seminari eventi convegni, premi etc.
[12]Per questa domanda possono essere utilizzati parametri come l’attinenza alla GRI, più un’analisi della rassegna stampa aziendale, rassegna stampa del settore di pertinenza, partecipazione a seminari eventi convegni, premi etc.
[13]Per questa domanda possono essere utilizzati parametri come l’attinenza alla GRI, più un’analisi della rassegna stampa aziendale, rassegna stampa del settore di pertinenza, partecipazione a seminari eventi convegni, premi etc.
[14]Per questa domanda possono essere utilizzati parametri come l’attinenza alla GRI, più un’analisi della rassegna stampa aziendale, rassegna stampa del settore di pertinenza, partecipazione a seminari eventi convegni, premi etc.
[15]Per questa domanda possono essere utilizzati parametri come l’attinenza alla GRI, più un’analisi della rassegna stampa aziendale, rassegna stampa del settore di pertinenza, partecipazione a seminari eventi convegni, premi etc.
[16]Per questa domanda possono essere utilizzati parametri come l’attinenza alla GRI, più un’analisi della rassegna stampa aziendale, rassegna stampa del settore di pertinenza, partecipazione a seminari eventi convegni, premi etc.
[17]Per questa domanda possono essere utilizzati parametri come l’attinenza alla GRI, più un’analisi della rassegna stampa aziendale, rassegna stampa del settore di pertinenza, partecipazione a seminari eventi convegni, premi etc.
Introduction
This short essay was put together and developed between December 2008 and January 2009 and is based on previous notes, following my reasoning at the end of 2007, on Game Theory applied to public relations, along with those made in September of 2008, on the ethical dimensions of business life in times of crisis.
This essay aims at creating “food for thought” for the reader and, in particular, for my colleagues, so that they may reflect on the present-day relationship between a company and an institution nowadays and their public interest.
However, I should like to go beyond the known hypotheses of doctrine, in an effort to offer, to the best of my abilities, a more “original” contribution to the discussion on these questions, by correlating the learning algorithms of artificial intelligence to the doctrine of Corporate Social Responsibility…Corporate Social Responsibility….known to those in the field with the acronym of “CSR”.
Let’s start from what is already known. Nowadays, it is common knowledge that companies- also thanks to a more direct access to user information – are far more interconnected to their surrounding environment than they once were, or, at least, one may say that they are more aware of the role they have taken on. This means that they have been invested with new responsibilities which cannot simply be ignored, if not at risk of being relegated to the margins of the competitive framework.
Indeed, some time ago, I wrote on my website: “The world-renowned economist and Nobel Prize winner, Milton Friedman once argued, in the 80s, that “the only “socially responsible action” for any firm would be that of taking on their responsibility of paying taxes”. However, time has drastically mutated this concept, as globalization has generated new concerns and expectations in consumers in communities, public authorities and investors alike.
This holds true for large multinationals as it does for the small factory: companies are strongly rooted and connected to the territory they operate in, as well as to society at large, often much more so than the entrepreneur him/herself is able to perceive. How, for decades, it was possible to consider a company, which is, as such, a living organism, as totally divorced from the environment in which it operates, remains a mystery. And then added: “Nowadays, companies have to decide how to deal with the reality of a truly global market– not only in geographical terms- but also, as has been common knowledge for decades, something that is part of a neuronal network of the society they work within”.
We must now reflect on the current ways a stakeholder’s network is “mapped”, the public involved and those involved on behalf of a company, an institution, and – why not – mapping for an individual (have you ever tried drawing your very own personal network of stakeholders, individuals and groups, the entities you depend on as individuals, whilst endeavouring to understand what you are doing for them and what they do – or not do – for you? Illuminating experience …).
As a rule, the company is represented at the centre of the sheet: all around it, each one connected by a line, are the various stakeholders. I am of the opinion that this “pictorial way” of representation goes way beyond a merely graphical aspect and ends up involving the deep philosophical aspect of the subject i.e. the way we perceive our role and how we intent to represent ourselves – in the broadest sense of the term – to what surrounds us. So as to be able to understand why, we must first go more into depth as to some of the aspects tied to the history of logic.
Aristotele’s “contradictions”
In the early ’60s, Lotfi Zadeh, a Full Professor at Berkeley University, famed for his contribution to the systems theory, was of the opinion that the traditional analysis techniques were so schematic and “precise” as to end up being not sufficiently adequate to describe many of the everyday problems in those times of strong renewal. Indeed, the logic of Aristotle, “the principle of noncontradiction (PNC)” still dominated numerous sectors. In classical logic, the principle of noncontradiction states that contradictory statements cannot, both, at the same time be true, e.g. the two propositions “A is B” and “A is not B” are mutually exclusive. In fact, Aristotle said that “one cannot say of something that it is and that it is not in the same respect and at the same time”. Trivializing, as we are sure that this someone is always sincere, it consequently follows that every statement he/she makes is true. If we claim that the assertion “X” made by this person has proven to be false, we then have something illogical: otherwise the first assertion i.e. that this person is always sincere, is wrong, or else it is a mistake to sustain that the affirmation “X” is false. What is sure-on the basis of Aristotelian logic-is that the two things cannot co-exist in the same way, at the same time. This is also in line with what we know as common sense, in as much as if what is aforementioned were possible, everything would be both true and the contrary of everything. A logical system where the principle of noncontradiction is considered valid, but, at the same time also contradiction is present- i.e. an affirmation is completely true just as is its negation- is, in reality, a system without logic, or structure, in as much as all propositions are true, as are their negation. Therefore, it cannot be interesting as it does not, in fact, communicate any “certain” information at all.
From a practical point of view, this results in a deterministic approach based on binary logic such an approach has been the rule for centuries and this type of approach foresees that: if accurate data and rigid planning process are set, then the results can be nothing other than precise.
However, Prof. Zadeh – and a few others just before him, with him and after him, such as Prof. Lukasiewicz – elaborated a new theory that, at first, was considered by some to be in contradiction with Aristotelian logic – which lead to heated academic discussions- but – as we shall see, turned out to be an extension of Aristotelian logic, dictated by the development of times and thoughts: logic “ infinite values of truth”, based on the concept of fuzzy sets, also known as fuzzy logic”; (from uncertain, or vague notions, blurred together… fuzzy ).
It is an approach to logic where”degrees of truth” may be applied to each proposition, ranging between a value of 0 and 1. This intuition, which is very useful to explain many modern phenomena, had been previously outlined by such researchers of the class of Bertrand Russell and Albert Einstein, but it was Prof. L. Zadeh, who, for the first time, codified it in an articulated manner. When we speak of degrees of truth, or degrees of membership, we mean –disorientating our Cartesian mentalities somewhat, which are imbued with the concept of “it is either true or false, or black or white ” – that a certain property, apart from being true i.e. with a value of 1, or false i.e. with a value of 0, as classical logic foresees, may also be characterised by an intermediate value: it is true that “ either one is dead or alive” (value 0, or value 1 respectively). However, it is also true that- in fuzzy logic – a value of 1 may be assigned to a newborn and a value of 0.8 to a an 18 year old boy, whilst a value of 0.15 may be assigned to a 70 year old man. Put in these terms it seems to be an inconsequential and trivial question, but this is not the case, as the codification of this reflection, under the form of mathematical algorithms, triggered off – as we shall see – a real revolution, in the modern world of logic.
True or False: paradoxes and “nuances”
Some have made an attempt to compare fuzzy logic to the probability theory. However, the probability theory describes bivalent random events that occur, or do not occur, without intermediate values. For a better understanding of the difference between fuzzy logic and the probability theory, let’s take a look at this example taken from the web: a batch of 100 bottles has five of them that contain poison. Let’s say that the probability of taking a bottle of drinking water from the batch is 0.95. However, after having taken a bottle, either it is potable, or it is not: the odds collapse to 0 or 1, whilst the fuzzy values may range from 0 to 1 (as the odds) but – unlike them – they describe events that may come about “to a certain extent”, according to a certain “degree of belonging” to a given set.
In the middle of the’90s Prof. Zadeh stated: ” In a broad sense, the term ‘fuzzy logic’ is synonymous of the ‘the fuzzy set theory’: a theory of classes with indistinct boundaries“. The fuzzy set theory is an extension of the classical theory of sets, because the classical Aristotelian principles of noncontradiction i.e. which foresee that, given two sets A and non-A (such as the example of truth and lies)- do not apply- each element that belongs to the set A cannot, simultaneously, also belong to the set non-A. In other words, according to the classical logic – in a hypothesis made up of only two sets – should any one of the elements not belong to set A, then it must necessarily belong to its complement set, i.e. the non-A set . Such a principles confer a strict logical bivalent character within the Aristotelian construction, a feature which remained basically unchanged until the 20th century, when the concept of uncertain, or vague notions were included in sets in fuzzy logic and allowed for the dissolving of the long series of paradoxes that were, not only created by the bivalence of classical logic, but ones that it had never been able to clarify. The oldest and most famous of these paradoxes is the one known as “the liar paradox” and is attributed to the Greek philosopher Eubulides of Miletus, who, in the 4th century B.C. stated: “The Cretan, Epimenides, says that all Cretans are liars “. It then follows that, according to the rigor of classical logic, if it is true that all Cretans are liars-then Epimenides is no exception – meaning his statement is false, therefore, Cretans are truth-tellers, so, he too is sincere, so Cretans are liars, and so on and so forth, without solution. Boiling things down to the essential, we may affirm, following the same structural paradox: “this statement is false” and in doing so we make our computer go into short circuit. However, in reality, what we are interested in demonstrating is that Aristotelian logic is unable to determine whether this proposition is really true or false. It is structurally incapable of providing an answer as it is bivalent, in as much as it allows for only two “truth values”: true or false, black or white, all, or nothing. This means that each and every attempt to solve the aforementioned paradox is transformed into a never ending oscillation between the two extremes. Finally, Aristotelian logic was unable to provide an effective response to the new problems the modern society posed to the researches and analysts.
According to fuzzy logic, the statement made in Eubulides’ paradox is neither true, nor false, but simply a half-truth, or, equivalently, a half-lie. The two possible conclusions to the paradox are presented in the contradictory form A and non-A, which, in itself suffices to affect the binary logic. Whilst it poses no problem for fuzzy logic, in as much as, when the Cretan is both a liar and a truth-teller at the same time, he does so only at 50% and this goes for whatever paradox of this kind is posed, following “fuzzy” logical principles, that is “fractional values of truth”. Which- by the way – stimulates us to reflect on the concept of sincerity and our relationship with the many “truths” that surround our everyday lives.
From theory to practical application: washing machines and high finance
The idea “grade of membership”, a concept which was to become the backbone of fuzzy sets, was introduced in the middle of the ‘60s by the Polish logician, Jan Lukasiewicz which, in turn, led Prof. Zadeh to publish his first seminal paper and the birth of fuzzy logic. Although the concept of fuzzy sets and fuzzy logic attracted harsh criticism from the traditional academic community, it was immediately taken up by several disciplines. Indeed, research on fuzzy logic was begun by two small university groups founded in Japan, in the early ’70s. The first control system for a steam generator based on fuzzy logic was developed in the middle of the ’70s in Great Britain, where fuzzy logic was also applied for the first time to an industrial setting, to control a kiln for cement production. As the devotees of Wikipedia, remind us, the ‘80s witnessed the launching of a number of successful important industrial applications of fuzzy logic in Japan: Hitachi automated the operational control system for high speed subway trains in the city of Sendai. Fuji Electric also successfully applied fuzzy logic to a wastewater treatment system. The success of these first experiments led to a boom in the application of fuzzy logic to industry. In the early ‘90s, Matsushita Electric Industrial Co. named their newly developed fuzzy controlled automatic washing machine “Asai-go (Beloved Wife) Fuzzy Day” and launched a huge commercial campaign for the “fuzzy” product. The campaign was a commercial success, not only for the product itself, but also for fuzzy logic technology, so much so that the foreign word “fuzzy” was introduced into the Japanese language with a new connotation: smart. Many other electronic companies launched fuzzy vacuum cleaners, fuzzy rice cookers, fuzzy refrigerators, fuzzy video cameras to control the stabilization of the image under shaky hand and jerky conditions and cameras with a more efficacious smart auto- focus. Indeed, the word “fuzzy” was awarded the neologism of the year and, on the crest of the wave of Japan’s successes, this technology stimulated extensive interest in Korea, Europe and the U.S.A.
Fuzzy logic was also soon to find applications in the field of finance. The first financial trading system to apply fuzzy logic was the Yamaichi Fuzzy Fund, which mainly dealt with stocks listed on Nikkei Dow and worked on a combination of fuzzy-based mathematical algorithms, which were verified and, when necessary, modified, monthly by expert analysts. The system was tested for two years and its performance, in terms of returns and growth, exceeded the Nikkei Average by over 20%. While still in the testing phase, the system recommended to “sell” as early as 18 days before Black Monday on the stock exchange, on 19th October, 1987.
In informatics, the first microchip to be based on fuzzy logic was developed in the middle of the ‘80s. These kinds of chips have the capacity to enhance the performance of systems used in applications that necessitate real-time choices and several companies then commercialised in both hard- and software instrumentation for the development of fuzzy-rule based systems. So as to make the idea clearer, let’s take another example proposed by a web surfer – a simple practical application of fuzzy system logic could be the measurement of a temperature for an anti-block braking system, capable of performing different functions, depending on the particular temperature range, so as to maintain the best possible control over the brakes. The three functions, cold, warm and hot are references, with all the intermediate variables: until such times as the value points to zero, the hot function is not true (“temperature not hot”), the function warm is only partially true ( it could be described in words as being “lukewarm i.e. slightly warm”), on the contrary, the blue arrow (which points to 0.8) indicates that the cold function is quite true (“fresh, cold enough”). This may well seem trivial when observed with the shrewd eyes of a 21st century beholder, but what should be understood is that mathematics based on the traditional Aristotelian logic did not have the capacity to deal adequately and efficiently with these kinds of processes.
From Fuzzy logic to “soft computing”: a first evolution in our stakeholders’ mapping
For those who have borne with me and have had the patience to read this overview up to this point, we shall now begin to go into detail as to the correlation between a particular application of the principles of fuzzy logic and Corporate Social Responsibility (CSR).
Developments made in fuzzy logic contributed to the institution of a new scientific discipline that led to a renewal of the sector of artificial intelligence, a discipline known as “soft computing”. The technique of soft computing aims at evaluate, calculating, deciding and controlling the scenario in an imprecise environment, something vague, fluid, or subject to continuous and sudden changes, emulating and taking advantage of the capacity human beings have in performing these activities, on the basis of their acquired experience. There are three main pillars that support this discipline:
– the possibility to model and control uncertain and complex systems, as well as to represent knowledge efficiently through the typical descriptions of the theory of fuzzy sets;
– the capacity to optimise the mathematical algorithms where computation is based on the laws of selection and mutation, typical of living organisms;
– the capacity to learn complex functional relations between neural networks, inspired by those of one’s own brain tissue.
According to Zadeh “…a growing trend is the use of fuzzy logic in combination with the neural computation and genetic algorithms. More generally, fuzzy logic, neural networks and genetic algorithms can be regarded as the principal constituents of what might be termed ‘soft computing’. Unlike traditional methods of calculation or ‘hard” calculation, soft computing is designed to adapt to the pervasive imprecision of the real world. Its guiding principle can be expressed as follows: exploit the tolerance for imprecision, uncertainty and partial or biased? truth to achieve tractability, robustness and low cost solutions. Over the next few years, soft computing is likely to play an increasingly important role in many sectors.“
Amongst the characteristic features of this scenario, we find data that are: not certain, ambiguous, or incomplete, randomness and solutions that are as approximate as possible: that is to say, what we have in real life, where fuzzy logic represents a truly effective “adaptive system”.
At the beginning of this overview, we recalled a traditional graphic “stakeholders’ map.” We may say, without fear of contradiction, that the stakeholders’ map, taken in the in traditional sense, can be traced back to a classical system of Aristotelian logic: either you are, or you are not a stakeholder (“or, is it true, or false”, a value of either 0, or 1): no more than a mere graphically represented list. If you are considered a stakeholder, then you will be the object of attention, otherwise you will not.
We have been applying some elementary fuzzy logic principles to my stakeholders’ maps for some years now. One measure I never fail to avail myself of is the drawing of a connecting line, which varies in length, evidencing the customer company and the stakeholder, where the length of the connecting vector line is directly proportional to the degree of attention they/he/she is enjoying at that given historical moment in time in the absence of crisis situations, whilst a code with “fuzzy colours” is used on my maps to indicate the possibility of an approaching situation of crisis (degree of “possible membership” in a crisis situation) and also – respecting the principle of “variable truth” – to what extent the mandator is currently predisposed to take in the hypothetical crisis and handle it efficaciously.
Nowadays, I have promoted in my staff yet another reflection, concerning the concept of neuronal networks, or “neural”, put in more orthodox scientific terms.
Complex neural networks
The most complete on-line encyclopaedia reminds us that “…the brain is a complex organisation of nerve cells that have the task of recognising configuration taken from the external environment, storage and response to stimuli”. So as to carry out these tasks, the biological cerebral network makes use of billions of simple computational elements (neurones) that are densely interconnected one to the other, in such a way so they are able to change their configuration in response to external stimuli: in this sense we may speak of evolution as a form of learning process and it is this model that the systems of artificial intelligence aim at replicating. A neuron is made up of three main parts: the cell body, the output line of the neuron (a single line, but one that splits into thousands of branches) and the input line that carries impulses towards the cell body, which receives incoming signals from the output line, from other neurones, through the synapses.
The cell body makes an evaluation of incoming signals: if the result is over and above a certain threshold value, then the neuron is activated, whilst if the result does not go over the threshold value, then the neuron remains in a state of rest.
Although the term “neural network” is traditionally used to refer to a network, or a circuit of biological neurons, its use has also been affirmed in mathematics, with reference to mathematical models of artificial neural networks, or circuits that represent interconnections between elements, known as artificial neurones i.e. mathematical constructs that, to a certain extent, “imitate” the properties of living neurones. An artificial neural network is an interconnection of a group of nodes, called neurones: it is an “adaptive” system, a modelling tool that changes its structure to adapt to the information that runs through the network in the learning phase.
These mathematical models are applied to solve problems of artificial intelligence, such as those that come up in several different technological fields: in engineering, electronics, informatics and other disciplines. However, on the basis of the research I have carried out, nobody has ever attempted to apply it to CSR.
The concept of artificial neurons was proposed for the first time in the’40s, in some of the research I quote in the bibliography of this overview and stimulated numerous studies and research projects in the scientific community. The ‘60s and 70’s witnessed a frustrating period and a standstill, as a result of the operative limits posed by the first simple networks that were not yet adequate enough to solve numerous classes of complex problems. Whilst the first really efficacious neural networks were developed in the ‘80s.
Researchers’ interest was mainly attracted to the possibility artificial networks have of “learning”: when given a specific task to solve, learning means taking advantage of the observation of the result so as to be able to find the best possible solution to the problem. The cost function is an important concept in learning: this involves the quantification of “how far from us” the best possible solution to the problem we wish to solve is, and, consequently, how much effort is required to reach this goal. Learning algorithms seek out solutions with the aim of identifying a function that carries the lowest possible “cost”. The training of a neural network is done- trivialising, and I ask the professionals in the field to forgive me for this – by the solicitation of the input nodes with a feed-forward propagation of signals through each level of the network, comparing the response of the network to the desired result, obtaining a corresponding error signal in the case of deformity and then propagating in the opposite direction to the synaptic connections of the error signal, thus “teaching” the network to minimize the difference between the actual output and the desired output. There are various learning paradigms that may be used to regulate the task of a neural network, but this analysis would lead us down an excessively technical and sophisticated pathway which, not only goes beyond my competences, but would also be of no relevance to our reflections. It suffices to outline that the aim of the activity of an artificial neural network is that of individualising the best possible operational method, starting from a process of observation of the external environment: each and every action has an impact on the environment and the environment produces a back-propagation that guides the algorithm itself through the learning process. This system postulates an agent that is endowed with perceptive capacities able to explore the environment, where it starts a series of actions. In turn, the environment itself, in response, provides either an incentive, or a disincentive, as the case may be and this is how the system learns and evolves. It is also interesting to note that if there is an input of very important data into a neural network, then it will have a heavy weight, if, on the contrary, there is an input of something of little importance to the elaboration, then this input will bear a lower weight, this is how the connections tend to strengthen when the pre-synaptic units and postsynaptic units agree with one another, otherwise, they tend to “weaken”. The same maybe said of CSR, where a flow of constant attention tends to qualify a relationship with a stakeholder and, conversely, ignoring a stakeholder completely creates a situation where it is impossible to perceive the arrival of even the most serious of crisis.
The most modern of today’s neural networks, not only have a bi-directional flow of information i.e. in both an input and output direction and vice versa – but the propagation may even come about from one of the successive, or previous neural layers, or may arise from neurones that belong to the same layer, or even between one neuron and itself. This is also true in CSR: would our input action towards the stakeholder, not end up by gene rating a re-elaboration of information also within the stakeholder him/herself, thus modifying his/her attitude along with the scenario he/she has to face? And would these modifications not end up by inevitably producing alterations- in both positive and negative – within our stakeholder’s boundary of public interest? In artificial neural networks, at the end of each phase in the learning process, the node with the vector that has a weight nearest to a certain desired result is considered “the winner” and all the other weights are updated accordingly, so as to come as close to that value as possible. As every node has a certain number of adjacent nodes, when one node wins the competition, the weight of the adjacent nodes is also modified according to the general rule that the nearer any node is to the winner, the stronger the variation in its weight will be. A map is built during the learning phase, therefore, the network configures and organises itself through a competitive process. This is exactly the same thing that takes place on a stakeholder’s map, where there is a strong possibility that a good practise be adopted by the whole network, which, in turn, becomes a new reference value.
Since a neural network is usually used to simulate complex relationships between inputs and outputs that other analytical systems are not able to represent, it is, in my opinion, also the best model able to represent the dense interconnections between a given subject and their public interests: whether or not they those known and “mapped”, or those that, in turn, depend on the ones known to us even if we may not even be aware of their existence.
A new task for neural networks: CSR
The tasks that neural networks are called to give an answer to range from vehicle control systems and industrial processes, to approximation processes forecasting storms, to the recognition of objects for security purposes in airports, to the verification of decisional processes, to name but a few. Why then not use them in simulations in the field of CSR?
As for any complex algorithm- it is true that also neural networks are efficient only if the “predictive” variables have been chosen with care and attention. As it is true that once a neural network is working to full capacity, it is so sophisticated as to prevent the analyst from carrying out an exact reconstruction of the way a certain result has been reached, thus reducing the power of control over the whole process. Moreover, there are no theorems, or, models as such that have the capacity to define a network as “optimal”, meaning that the efficacy of a network mainly depends on its creator’s experience.
Nevertheless, as I already expounded in my overview on Game Theory, by putting into practise what I have illustrated herein, it should be possible for researchers to elaborate innovative solutions to be applied to the field of CSR that will permit professionals to free themselves of the limits posed by “I’ll do it because others have done it like that, so I think it could work”, or “we’ll do it this way because we’ve always done it this way before”.
In anticipation of obtaining the support of some expert in the field to elaborate one, or more predictive mathematical models that maybe used to overcome the trap of
“I can learn only my mistakes”, also in CSR, something which is of little profit from a financial point of view, let’s start applying these philosophical concepts that generally rule our everyday working life.
Enough with all these 2D stakeholders’ maps, if it is true – as we all advocate- and this is the concept at the basis of the theory of Corporate Social Responsibility – that the client company is part of an extremely complex network of relationships. I am of the opinion that the model of artificial neurons is able to make an efficacious representation of the reality of the interactions between a company, or institution and all the public interested in them and which are interesting for them at the same time, clearly-as I stated above – an input inserted into the network (our stakeholder’s network) will solicit the input nodes (the stakeholder is an object of attention at that moment) with a forward propagation of the signal, this will lead to a comparison of the network response (the whole of our stakeholder’s network) with the desired result, there is the possibility of getting a corresponding error signal in case of discrepancy, which then would propagate in the inverse direction to the signal, “educating” the whole network and minimizing the difference between the desired output. Whether we like it, or not, this is the effect we trigger when we take the initiative to stimulate our stakeholder’s network and there are thousands of case histories testimonial to this effect.
The Spanish-based fashion chain Zara, owned by the Inditex group, imposed the closure of a sister factory of one of its suppliers, after a BBC television network had informed the Spanish group of the physical and verbal violence the workers were exposed to and the extremely bad environmental conditions they were obliged to work in. When the Zara inspectors finally managed to get inside the factory that had been reported, they were so shocked by deplorable conditions they saw that they gave the factory owner an ultimatum: close this factory and improve conditions at a new site, with your workers, if you want Inditex (and Zara) to remain a customer of yours. The supplier accepted the conditions made by the Spanish inspectors and employed the workers from the old factory, that would have otherwise been unemployed, at the new site. Moreover, Zara’s supplier committed themselves to recognising the Bangladeshi unions in all their factories. This is a clear example of how an input inserted into the stakeholder’s network of a multinational company generated such a return flow so as to condition many more elements in the scenario than those initially solicited– here in positive, even if it is not always the case.
Guna Spa, the first Italian player in the field of natural and homeopathic medicines and amongst the first five companies in the world in its category, does not consider the interruption of business relationships a first-line solution in the presence of qualitative discrepancies – which is a common practise so as to safeguard against public criticism and judiciary bodies. Guna is well aware that such an action would generate a negative backlash on the supplier’s workforce, that, although have a low responsibility level in the scenario, would most likely end up taking the book and paying the price. Indeed, their charter of ethics also includes the following: “…GUNA Spa is aware of the importance of the role of its supplier companies in their socio-economic system (in particular as generators of vital income for the families of employees and minor shareholders) and of the importance of these companies in their turn for the suppliers from which they obtain raw materials. In the event of non-compliance, either full or in part, with the criteria dictated by this Charter of Ethics, the first option of GUNA Spa will not be to promptly and definitively terminate supply relations, but rather, after the emergency has been efficiently solved and the interest of citizens and patients protected at all costs and in every possible way and always in relation to the gravity of these violations, to provide, at the expense of, and organized by, GUNA Spa, guidance and assistance in order to improve the scenario existing at the supplier’s, to prevent the problem from recurring”. This is an example of adaptive behaviour for learning, aimed at improving on the existing scenario “educating the neural network” where Guna operates and competes.
The State Treasurer of Pennsylvania, Robin L. Wiessmann announced that she would divest from China Petroleum and Chemical Corporation (Sinopec), responsible for operations in Sudan, where the Khartoum government drew funds from the activities of foreign companies to supply arms to those responsible for the genocide in the Darfur region. The divestment in Sinopec was equal to $1.2 million, not such an enormous sum. This measure was taken after China Petroleum’s refusal to engage its shareholders in dialogue as to the risks of its presence in Sudan. The Pennsylvanian minister took this decision on the basis of modifications made in the state’s investment policies, which also involved an evaluation of geopolitical, environmental, governance and other strategic factors. Also following this decision, that stimulated debate amongst analysts and the political class alike, the then American president – George W. Bush – signed an Act that allowed then– as it does today – any state authority to withdraw it investments from companies operating in Sudan, due to the violence in Darfur. This is yet another case where an action versus a stakeholder created a much wider effect than had been foreseen.
There maybe many other examples, but what is clear and what companies and institutions have demonstrated – at times without actually being fully aware of it – is that they behave as part of a “social neural network”. Then it is up to the professionals in the sector to make their own reflections and to enhance their knowledge of their own clients, adopting more sophisticated predictive systems able to increase the control index on the complex scenarios that challenges in the 21st Century face us with. One thing that is certain is that our level of responsibility and the quality of the governance mechanisms must make a rapid rise, as a direct consequence of the newly found awareness of the degree of the impact level our determinations have on entities that we are apparently connected to.
Modern technologies and social networks are accomplices, each and every entity– individual or collective – is immediately and permanently connected with their very own referents and give daily responses to the streams of stimuli, information and emotions they collide with: all of which makes it clear how every entity is nothing but a “node” in a much more ample system, one which I define as social neural network. As Derrick de Kerckhove, tells us in his brief, but most beautiful essay, entitled “There’s a robot in my Body”. This network is “quick, transparent, potentially ubiquitous and liquid”. It is as I have described it in this paper, each and every input triggers a strong variation in the scenario, both the one “in proximity” and the one – which is, more or less distant, maybe not even “mapped” by us- something we are in contact with only through other nodes: simply, as each node has a certain number of adjacent nodes, when one of the nodes wins a competition (an action on a stakeholder that improve/worsens our reputation profile), also the weights of our adjacent nodes are modified (also the other stakeholders improve/worsen our rating and, in turn, this activates internal procedures to improve their own), in line with the general rule that the more nodes (one stakeholder) are close to the winning node, the more marked the variation in their weights will be. In this way the interaction is continuous and immediate, is this then not what happens when we spur one of our stockholders? Surely, a stakeholder in our proximity – such as a supplier, or an employee – would be more attuned to our input, but, in turn, also our suppliers will be spurred, as most probably also our employees’ family members will benefit from our intervention.
The Vedas – thousand of years ago-described us as part “a unique One, interdependent one on the other” connected, regardless of distance, much more tightly than we might imagine. We might then write and discuss about Corporate Social Responsibility as being a discipline that can be used to draw the contours and valorise the existence of a “supreme neural network”: the complex network that, at a planetary level, places each one of us in relationship with another, each institution with another institution, each company with another company and all these elements organically between one another.
A neural network that is the natural evolution of a social system, or i sit the proof o fan act of creation?
From the theoretic analysis to practise: a new type of stakeholders’ map
One of the most recent fields of research I have undertaken so as to promote the concept of social responsibility as a strategic dimension of the life of a company, proposed to meet the ever increasingly felt need to “measure” CSR, in an attempt to move away from a merely empiric concept – towards a more scientific approach- involving both the discipline and professional methodology of those who deal with CSR in their daily routine.
The theoretical basis of the method we have elaborated is described in the first part of this overview, elaborated in 2008, where I hypothesized the application of the principles of fuzzy logic and the functional mechanisms of artificial neural networks to both CSR and stakeholder mapping. I did so starting from the presupposition that “all types of public are stakeholders” and by reflecting on the effects a company’s behaviour (the company being part of a complex neural network) –on the “stakeholders of the stakeholders”, who are all too often neglected. Indeed, I, as other colleagues, some time ago achieved a certain degree of awareness, that, at risk of trivialising, I shall try to synthesize for further clarity.
A company is part of a social network which is much vaster than one would normally imagine;
Starting from these assumptions, the company as such has “disappeared” from my stakeholders’ maps for some years now. That is, the company as envisaged traditionally in the centre of the map itself: the organisation has become a “a texture”, where, in turn, the stakeholders are depicted, giving a better representation of the “connection” between the company itself and its various public.
Our first step in its application was firstly done within our staff, then through seminars, by discussing it with dedicated personnel and then, as from the year 2008, it was also applied to our new form of client mapping – by starting to depict the stakeholder’s map on a Cartesian graph in quadrants[4]. When custom-built for the job, this kind of map is able to measure the degree of “influence”, interconnection and potential crisis the company in question has on each single member of its various public, in a more efficacious way than are the more traditional maps.
However, the data required to make a correct positioning of the stakeholders on the graph still originated from the returns of an internal audit. Even if this audit was well-constructed and carried out by us in a consultancy capacity, the degree of approximation, relative subjectivity and method still did not satisfy me to the full.
This led me – with the precious help of my staff, to create an instrument[5] that has the capacity to evaluate the degree and typology of the company’s social responsibility in a more analytical way. One that defines a unique framework, one that is as tailor-made as possible, in terms of precise reference standards, which, apart from other aspects, allows for the comparison of performance amongst the companies that compete for sustainable development, as the international GRI Sustainability Reporting Guidelines we all know have done, in terms of classification within social reports.
What I am speaking of is a reproducible criterion of the determination of the positioning of the stakeholders on a Cartesian map in quadrants. This methodology is applied with the aim of providing an instrument able to evaluate the degree of stakeholder engagement between the company and its public. Moreover, it allows its public to be inserted correctly on the map by the application of a “point scoring” system, which does not elide from the professional observation of the consultants, on the contrary, it is valorised, balancing it against the objective data obtained from the reconciliation of the results of the audit not only with the perception that the company has of itself, but, in turn, the perception the stakeholders have of the company.
Here are the main elements the method is based on:
It is to be filled in so as to collect the appropriate fundamental information able to identify the sensitivity and degree of “literacy” on the company’s CSR and the “kit” of basic instruments required to complete a successful CSR project.
The questionnaire is elaborated “ad hoc” for each single category of stakeholder (they are not included in this paper for lack of space, as they are some ten pages or more).
Each question is assigned a score which goes from -2 to +2 and defines the “degree of maturity” reached by the company as to the question under analysis. When assigning points the following values are taken into consideration:
– 2 absent
– 1 low
0 average
+ 1 high
+2 very high
The form is to be filled in by:
For each stakeholder – or group of stakeholders, where, for practical reasons more stakeholders must necessarily be incorporated into one category – an articulated checklist, subdivided into three sections A, B, C, has been prepared, functional one to the other (each one is, therefore, to be filled in by all three of the aforementioned categories):
Simulations have been made, also with the aim of inserting corrective values into the computation method in an effort to guarantee the most trustworthy results as possible.
The values in the field (A) will define the position on the axis of the abscissa (x) influenced by (C) at 50% as a corrective value.
The dimension of the rectangle where the position of the stakeholder is reported on the map – a dimension that represents the importance/control on the SH perceived by the company – is defined by the value of (A) influenced by (B) to 30% as a corrective value.
The values in field (B) will indicate the position of the ordinates (y) on the axis.
The values in field (C) will influence the axis of the abscissa by 30%, but, above all they will determine the relative chromatic scale of the potential crisis profile – in relation to the stakeholder – classified as follows:
An Outline of Mapping Set-up on the Basis of The New Positioning Criteria[6]
(the graphic form is not indicative)
Even if only 5 stakeholders from a “typical” medium-sized company have been proposed as examples in this article, operating on the Italian market in the production of consumer goods, a first series of stakeholders has been defined and a tailor-made checklist of questions set up (obviously differing between one SH and another):
It is evident that professional practise dictates that every company will be object of study and every map will have typical characteristics where the public involved will vary from one company to another; from here the necessity to elaborate new customized checklists, thus building up a store of knowledge and competences that will be enriched with every mandate, and which may then be put to dynamic use in the various professional mandates.
The results obtained for each of the aforementioned categories, after having filled-in the checklist (management, employees, stakeholder/CSR manager/external consultant), stakeholder by stakeholder, will then be elaborated according to criteria of arithmetic average and, at first, will show the variance between the perception of each one of the three categories under study, compared to the current relationships present between a given company’s public.
Any variance over and above 30% between the results supplied by one category and another will be evaluated as an index of criticality, which is to be examined and that will compete in the definition of the potential state of crisis versus the stakeholder.
Once the stakeholder’s position has been correctly defined, on thee basis of the global perception (amongst the three categories), the company, on the basis of the position of each stakeholder category on the map, can – following the indications set up by the United Nations Environment Program[7]– consciously identify itself in one of the following development phases (always with reference to varying scores, according to a logic of fuzzy sets):
At this point, the map will be compared to the “OBJECTIVE” map that has been defined by the management/owners, who will then have at disposal a new instrument for the alignment of the company strategy to expectations of its own internal and external stakeholders, thanks to the adoption of adequate responses able to meet the requirements that have emerged during the processes of auditing and mapping.
I have reason to believe that this paper may be a useful stimulus for my colleagues and -also with the aim of future collaboration to enhance work methodology – I willingly put these competences at disposal under the licence Creative Commons[8] and am more than willing to accept each and every suggestion and/or criticism[9].
There is a further enhancement in quality through the activation of a “Participatory Micro-blog ”: The Corporate Story Telling on-line is in real time, from the “narrative voice” to the shared construction of the message.
In a recent reflection in “Business”, Toni Muzi Falconi[10]called the readers’ attention to the characteristic of “organisational reporting” in companies (“Corporate storytelling”). Nowadays, companies relate to a varied public: “traditionally – Muzi Falconi reminds us – consumers were the favoured terrain of its communication, simply because only a push of information on products and services could make people aware of their existence and stimulate their purchase. However, nowadays, employees have joined ranks alongside consumers with a fundamental role, as have investors ,public regulatory bodies, suppliers, the local communities and many others and each one of these maintains relationships with the company, through many and varied channels”.
It then naturally follows that this produces narratives with different contents, not only in form, but also in the instruments used to dialogue with one’s own referent public. On the other hand, trivial though it might be to bring it to mind, the stakeholder mapping should be propaedeutic, not only in its reporting in the form of the social report, but also in its structuring of communication strategies and, above all, with tailor-made dialogues with all the types of public involved. For years now I have been suggesting to clients to structure multi-channel web-sites so that they can activate dynamic dialogue ad hoc as to the identity, characteristics and expectations of the various stakeholders.
We have made a further step foreword – after the elaboration of the theoretic basis described in the first part of this overview – with the creation of an innovative stakeholder’s map on Cartesian axis in quadrants, that allows us to abandon a procedure of a purely empiric definition of the types of public on the map, based only on the consultant’s observations and auditing activities, passing to a procedure based on scientific and more objective criteria.
Some months ago, along with Luca Yuri Toselli, I stimulated a client company to open up even more in the direction of transparency of its processes and in the sharing, not only of values, but also the instruments used to relate them.
To this aim we then published an outline of the company’s social report on a dedicated web site, with open access for consultation and, above all, interaction, with all the company’s referent public. The definitive version that was later printed- on DVD, as a saving initiative on the environmental impact – was the fruit of this “contamination”, on line with our vision of the CSR theory: the company does not DO CSR, but it IS its own CSR, and – if we take as true a total coincidence and superimposition of interests between the company and its various public – then the act of reporting can have no meaning if it is prepared by the company alone, net of the stakeholders, in a unidirectional manner. It must necessarily be a “choral” act, written by more than “one” i.e. along with the stakeholders and shared with them right from its very first letter on a blank page in “Word”.
That is why we inevitably ended up at a yet another step: we set up a kind of articulated “dashboard of dynamic indicators” that – following in the steps of the social report for the year 2010 –the data, tables, information and, above all stories are being enriched, along a one year pathway, sharing everything in complete transparency and literally “building” along with all the company divisions and all those who make up the company’s neural network. In this way the first unpublished “real time” social report has been born, which is in itself a method of stakeholder engagement able to transform the various types of public into strategic elements for the definition of the company’s CSR into co-management.
Even the choice of the icon for the project was a useful opportunity for comparison and exchange of ideas: at first we had thought of evidencing the immaterial value of the company’s “transparency” through the symbol itself. On the wave of emotion generated by the score + 2.0 and the concept of a “crystal house”, we fled down the pathway to ice, or an expanse of crystal clear water.
But, then again, it seemed to be a Déjà vu, obsolete, an expression of something like “we are open and transparent, if you want you can read more inside”. Well then, alright, better than nothing, but we were really aiming at something different, we wanted to take yet another step forward: emphasising the role of “Big Brother” which, in this project, we recognised in our stakeholders, some of us, but also “investigators” deep within the company’s fabric.
Then we ended up calling the project with the neologism “Web-Cam”, which immediately brings to mind the impossibility of subtracting ourselves from judgments on the way we live our time and space and the space of “others”, or the other part of the poliedric identity in each one of us, parts that, unfortunately, for too long a time had been relegated to the simple role of onlookers and users of prepackaged messages and, in line with this concept, as a symbol, we chose a large, tender snowman in the shape of an eye, with a dilated pupil and a huge magnifying glass in his hand. Which, translated from the symbology of narration, for us meant: we are not only ready to let you look inside us , but we invite you to do so, moreover, we recognise your right to do so and we even give you the instruments to do it properly.
Clearly, all of this implied that the entrepreneur be willing to really put himself/herself f at stake and play the game, apart from the words, the propaganda and the greenwashing. Luckily it is an Italian company with a strong character of innovation and has already accepted the challenge[11]: we’ll keep you posted as to the developments.
However, how long will it be before we have a really and truly 2.0 approach from the large groups? Why is it so as to obtain the information on the automobile production that left the factory this week have I necessarily to contact the group’s press office? Why is it not possible for me to simply connect on-line and follow a “story-line” that the company tells me, moment by moment, without mediation, maybe also offering my contribution to the idea as to how I would like this story to be told to me? A new challenge in terms of sharing, for the commissioner and we as public relaters and communicators alike, which we must interpret.
Would such an approach, which is almost disintermediated, make our professional contribution superfluous? I don’t think so, I believe, if anything, it would lead us to refine our instruments, obliging us to provide services with ever higher adjunctive value. Which is, and has always been, the core of our beautiful profession.
APPENDICE
– The reference checklist for each stakeholder (elaboration is being completed and
enhanced)
– Author: Luca Poma
– Brief bibliography
The reference checklist for each stakeholder
1) Environment
A) The influence the stakeholder has on the firm
(Horizontal axis :the stakeholder influences/ does not influence the firm)
A6 Management capacities, through the implementation of instruments for crisis management, of the tensions in the environmental field.
A7 In the recent past, has this company had particular tension with this stakeholder?
The legend below shows how to assign a score to this question:
| > 7 crisis in the last 5 years | -2.00 |
| Between 4 and 7 crisis in the last 5 years | -1.00 |
| Between 2 and 3 crisis in the last five years | 0 |
| 1 crisis in the last 5 years | 1.00 |
| No crisis in the last 5 years | 2.00 |
B) The influence the company has on the stakeholder
(vertical axis: the company influences the stakeholder / does not influence the stakeholder).
C) Stakeholder engagement:
(the influence the stakeholder has on the company – partially– and colour dimension: cataloguing of the crisis profile)
2) Employees
A) The influence the stakeholder has on the company
(horizontal axis: the stakeholder influences the company( does not influence the company)
A1 The presence/absence of a union representative in the company and the company’s attitude to “unionizing”.
A2 The predominance of forms of contracts that guarantee stability to the employees governing temporary labour, dedicated personnel working on a project basis and other atypical contracts.
A3 Provision of ” manoeuvrability space” which flows from the management to the personnel ( with only tasks such as drawing up contracts and calculating payrolls or “going into the issues in depth”, by running training programmes etc.).
A4 How the company is considered in terms of policies adopted for their staff (may it be regarded as “the best in the class/leader“, a “follower“, does it follow and reproduce best practice policies of others, is it “indifferent”, “the worst” ?[13]
A5 Management capacities, through the implementation of instruments for crisis management, from the tension in the organisation of the personnel (e.g. disputes, strikes, reorganisation plans with consequent redundancies, and the like ….)
A6 In the recent past, has this company had particular tension with this stakeholder? The legend below shows how to assign a score to this question:
| > 7 crisis in the last 5 years | -2.00 |
| Between 4 and 7 crisis in the last 5 years | -1.00 |
| Between 2 and 3 crisis in the last 5 years | 0 |
| 1 crisis in the last 5 years | 1.00 |
| No crisis in the last 5 years | 2.00 |
B) The influence the company has on the stakeholder (vertical axis: the company influences the stakeholder/does not influence the stakeholder).
C) Stakeholder engagement
( The influence the stakeholder has on the company – partially– and colour dimensions: cataloguing of the crisis profile)
3) Suppliers
A) The influence the stakeholder has on the company
(horizontal axis: the stakeholder influences/does not influence the company)
A5 Managerial capacity, through the implementation of crisis management
instruments, of tension arising from the supplier chain (e.g. in the case of re-sale of
non-conforming or damaged goods, charging accusations made by
=NGOs and other similar actions due to bad practise in the supply chain etc)15
A6 In the recent past, has this company had particular tension with this stakeholder? The legend below shows how to assign a score to this question:
| > 7 crisis in the last 5 years | -2.00 |
| Between 4 and 7 crisis in the last 5 years | -1.00 |
| Between 2 and 3 crisis in the last 5 years | 0 |
| 1 crisis in the last 5 years | 1.00 |
| No crisis in the last 5 years | 2.00 |
B) The company’s influence on the stakeholder (vertical axis: the company influences the stakeholder/does not influence the stakeholder).
C) Stakeholder engagement
(The influence the stakeholder has on the company- partially– and colour dimensions: cataloguing of the crisis profile)
4) Clients
A) The influence the stakeholder has on the company (horizontal axis: The stakeholder influences the company/ does not influence the company)
| > 7 crisis in the last 5 years | -2.00 |
| Between 4 and 7 crisis in the last 5 years | -1.00 |
| Between 2 and 3 crisis in the last 5 years | 0 |
| 1 crisis in the last 5 years | 1.00 |
| No crisis in the last 5 years | 2.00 |
B) The influence the company has on the stakeholder (vertical axis: the company influences the stakeholder/does not influence the stakeholder).
C) Stakeholder engagement
(The influence the stakeholder has on the company – partially– and colour dimensions: cataloguing of the crisis profile)
5) Social community
A) The influence the stakeholder has on the company
(horizontal axis: is considered influential/not influential on the company)
| > 7 crisis in the last 5 years | -2.00 |
| Between 4 and 7 crisis in the last 5 years | -1.00 |
| Between 2 and 3 crisis in the last 5 years | 0 |
| 1 crisis in the last 5 years | 1.00 |
| No crisis in the last 5 years | 2.00 |
B) The influence the company has on the stakeholder
(vertical axis: the stakeholder is influenced by the company/ in not influenced
C) Stakeholder engagement
(The influence the stakeholder has on the company – partially – and colour dimensions: cataloguing of the crisis profile)
6) Public/journalistic/media opinion
A) The influence the stakeholder has on the company
(horizontal axis: the stakeholder influences the company/ does not influence the company)
A2 In the recent past, has this company had particular tension with this stakeholder? The legend below shows how to assign a score to this question:
| > 7 crisis in the last 5 years | -2.00 |
| Between 4 and 7 crisis in the last 5 years | -1.00 |
| Between 2 and 3 crisis in the last 5 years | 0 |
| 1 crisis in the last 5 years | 1.00 |
| No crisis in the last 5 years | 2.00 |
A3 Presence in the media, number of publications (quantitative and qualitative analysis).
A4 How the company is considered non riflessivo in terms of the quality of the relationship it has with public opinion (may it consider itself the “best in class/leader “, a “follower“, does it follow and reproduce others’ best practice, is it “indifferent”, the “worst” does the company have a person to deal with public opinion, journalists and the media? )[16]
B) The influence the company has on the stakeholder
(vertical axis: the company influences the stakeholder/does not influence the stakeholder).
B1 Degree of activity of the press office (indicate whether it is internal or external to the company).
B2 Degree of collaboration between the press office and the various company areas for external communications (indicate if dedicated lines are foreseen for communications: commercial, institutional, CSR activities etc.
B3 Company participation in conventions, seminars etc. in the industrial sector.
B4 Company participation in conventions/seminars/ meetings on the evolution of corporate culture.
B5 The requests to cite the company in thesis, studies research etc.
B6 The company’s willingness to support researchers and students who wish to analyse case studies on the company or its field of interest for surveys, research, thesis and studies.
B7 Participation in exhibitions, fairs cultural events that do not necessarily have a promotional commercial target, but rather an “informative” cultural one.
B8 The sponsorship of the aforementioned events apart from participation in the preparation and dissemination of the contents.
B9 Social and environmental communications.
B10 Dialogues with consumer councils/associations.
B11 Periodic investigations into the clients’ requirements and level of customer satisfaction.
B12 The research and development of new products/services to meet the clients’ needs(capacity for renewal and continuous enhancement).
C) Stakeholder engagement
(The influence the stakeholder has on the company – partially – and colour dimensions: cataloguing of crisis profile)
C1 The company’s proactivity in the organisation of cultural events (seminars, studies, university courses, or at other institutions and cultural organisations) and support of “thinktank” activities in their pertinent sector.
C2 The presence of journalistic focus groups and/or opinion leaders in the implementation phase of communication strategies.
C3 Involving journalists in periodic “briefings” and other restricted relational activities.
C4 There being a crisis room on the company premises, focused on the management of communication crisis cases.
C5 Presence and training for use of the communicational crisis room.
C6 The frequent and periodic use of level “2.0” channels of communication in dialogues with the public opinion. (e.g. the company takes part in on line debates on blogs and forums etc.. on topics concerning them?)
C7 The adoption of other incentive policies to involve journalists and communicators.
C8 The Monitoring, evaluation and reporting of information activities.
C9 The presence of an editorial division in the company, or company divulging activities.
C10 The reporting of these activities in the social report and/or other forms of reporting to the public.
7) The financial community
A) The influence the stakeholder has on the company
(horizontal axis: the stakeholder influences the company/does not influence the company)
A1 The timing and efficacy of current analysis of economical and financial reports.
A2 The solidity of the relationships with banks and creditors (present an annexed abstract on the analysis of the persons responsible for the report to the financial community, to the mandate and on the degree of autonomy these persons have).
A3 Reporting to the stakeholders, apart from the standard communications provided for in the company laws/rules/regulations
A4 Degree of participation in the stakeholders’ meetings.
A5 Degree of involvement and enrichment for the managers apart from the topics strictly of a statutory nature.
A6 The importance attributed to the company’s performance: focus on the quarterly report, or on reaching medium-term objectives set in the industrial plan. An analysis of the managerial staff turn-over and the motivations for this issue.
A7 An analysis of the internal governance model.
A8 In the recent past, has this company had particular tension with this stakeholder? The legend below shows how to assign a score to this question:
| > 7 crisis in the last 5 years | -2.00 |
| Between 4 and 7 crisis in the last 5 years | -1.00 |
| Between 2 and 3 crisis in the last 5 years | 0 |
| 1 crisis in the last 5 years | 1.00 |
| No crisis in the last 5 years | 2.00 |
A9 Managerial capacity, through the implementation of crisis management of the
tension associated to this stakeholder.
B) The influence the company has on the stakeholder (vertical axis: the company influences the stakeholder/does not influence the stakeholder).
B1 Public relations activities focued on the financial world.
B2 The timing and degree of emphasis reports on the company’s overall performance/trend and financial performance have.
B3 The degree of independence and objectivity those entrusted with the certification of financial statements have and other financial indicators.
B4 The adoption of cross-checking instruments.
B5 The predisposition the managerial staff have to the disclosure of their knowledge as to medium-term industrial plans.
B6 Respect for the milestones set out in the industrial plans: on the managerial side- and in respect of the financial community.
B7 The presence and dissemination of an ethical code, or map of corporate governance.
B8 Respect of the code of ethics/map of ethics of the corporate governance.
B9 The delegation of an external certifying body to verify the compliance to instruments.
B10 The presence of other instruments for information transparency as to the financial performance.
C) Stakeholder engagement
(the influence the stakeholder has on the company – patially – and colour dimensions: cataloguing of the crisis profile)
C1 The presence of a crisis room and training in its use with focus on the trend of the financial indicators.
C2 The adoption of public relations policies with the financial world other than the standard communications provided for by laws in force.
C3 Periodic involvement of banks, investors, financial institutions and of control in meetings, briefing, release, focus…
C4 The sharing and discussing of short-term financial plans as well as medium-term industrial plans, with focus groups that are representative of the financial community.
C5 The involvement of stakeholders, creditors, investors in periodic updating of the charter of ethics as to company governance.
C6 Verification of respect of the charter of ethics as to company governance.
C7 Degree of dissemination of economic/financial company reporting. (the budget is published on the company’s website, promoted through advertising campaigns, is modified in a reduced and synthetic version for the general public, is presented and explained in detail in ad hoc events, or on other occasions in meeting with sector-based operators? Indicate dissemination mode).
8) Institutions/ regulatory authorities
A) The influence the stakeholder has on the company
(horizontal axis: the company is influenced by the stakeholder/ is not influenced)
A1 The company’s dependence on legislative actions in their referent industrial sector, or on special regulatory restrains particular (e.g. in the case of pharmaceutical or food sectors for consumer protection, or the import-export of environmentally “sensitive” materials, such as petroleum or uranium, or financial/insurance activities etc. with a strong presence of the appropriate control bodies at a national or international level).
A2 The presence of reforms, or other important legal/regulatory procedures in the last few years.
A3 Dependence of the industrial sector on any kind of “blocked market” (municipalized, collectivised sector, etc?)
A4 Liberalization or presence of any other structural interventions in the sector.
A5 Relevance, or prevalence of the company working with the public sector, supply of services and support products, or in conventions with the public sector (e.g. the levying of taxes and contributions, or the medical sector in conventions with the National Health Service, or the granting of motorways or other infrastructures, etc.)
This analysis is carried out so as to understand to what degree the business continuity itself is subject to regulator/ legislative variables, with consequent influence of the bodies charged with the existence of the company.
A6 Managerial capacity, through the implementation of crisis management of the
tension associated to this stakeholder.
A7 Consideration of the company in terms of the quality of the relationship it has with this stakeholder (does it consider itself the best in the class/leader, follower, does it follow and reproduce others’ best practice, the worst, is there a person responsible for relationships with this stakeholder? )[17]
A8 In the recent past, has this company had particular tension with this stakeholder? The legend below shows how to assign a score to this question:
| > 7 crisis in the last 5 years | -2.00 |
| Between 4 and 7 crisis in the last 5 years | -1.00 |
| Between 2 and 3 crisis in the last 5 years | 0 |
| 1 crisis in the last 5 years | 100 |
| No crisis in the last 5 years | 200 |
B) The influence the company has on the stakeholder (vertical axis: the stakeholder is influenced by the company/ not influenced).
B1 The company adoption of a dedicated institutional public relations line (indicate the person/s responsible for the relationships with the referent bodies).
B2 The adoption of a generic institutional public relations line towards the local and national political world.
B3 Internal management of these relationships (indicate whether or not it is managed with the support of PR agencies and specialised Lobbies.
B4 Participation in joint boards with institutions, or other sector-based actors, or in theindustrial sector.
B5 An active role in sector-based organisations, or employers, or in other types of business organisations.
B6 Participation in events, manifestations, studies, research and other activities inherent to the culture of the company’s sector, with co-participation of the referent public entities.
B7 Medium term public relations activities in support of the claims made by the sector to the institutions.
B8 Internal company charter of ethics, which expressively forbids any hidden conditioning activities with politicians and/or institutional referent representatives.
B9 Internal company charter of ethics that imposes transparency criteria for any lobbying activities.
B10 Activities that stimulate involvement, periodic briefing, participation in television programmes or any other public debates on involvement.
C) Stakeholder engagement
(The influence the stakeholder has on the company – biased-and the colour dimension: the cataloguing of the crisis profile)
C1 Participation in activities involving proposals of legislative reforms in the sector.
C2 Participation in interinstitutional boards with discussions sectorial legalisation.
C3 Activities aimed at the sensibilisation of the public (on media) as to the regulatory requirements of the sector.
C4 Active support (including sponsorships) of consumer associations implementing initiatives in the referent industrial sector.
C5 Reporting of the activities of lobbying, to the community and media and the listing of these activities listed in the social report.
9) Category associations / competitors
A) The influence the stakeholder has on the company (horizontal axis : the stakeholder influences/does not influence the company)
A1 The company being subscribed to category employer associations.
A2 The company being subscribed to sector-based category associations.
A3 The relevance associations/competitors’ capacity for technical/process innovations has had in the recent past on the sector.
A4 The relevance associations/competitors’ capacity of innovative rules/regulations or processes have had on the sector in the recent past.
A5 The ease of relationships with referent competitors (or have there been recent he cases of open conflict or mediatic “clashes” on particular issues?).
A6 A comparative analysis of the reputational profile of the company brand with its main competitors.
A7 Frequency of surveys and monitoring activities in the sector and the early detection of new trends/innovations that may be taken advantage of, or that are being promoted by unusual competitors (see for example the advent of “low cost” air travel ).
A8 Managerial capacity, through the implementation of crisis management of the tension associated to this stakeholder.
A9 In the recent past, has this company had particular tension with this stakeholder? The legend below shows how to assign a score to this question:
| > 7 crisis in the last 5 years | -2.00 |
| Between 4 and 7 crisis in the last 5 years | -1.00 |
| Between 2 and 3 crisis in the last 5 years | 0 |
| 1 crisis in the last five years | 1.00 |
| No crisis in the last 5 years | 2.00 |
B) The influence the company has on the stakeholder (vertical axis: the stakeholder is influenced by the company/is not influenced).
B1 The company takes an active part in employer and sectorial associations’ initiatives.
B2 How seats in representative or executive roles are assigned.
B3 The adpotion of joint lobby policies and activities with sectorial associations.
B4 The presence of joint informative activities and those aimed at the sensibilisation of the public – on specific sectorial issues – with sector-bases associations and/or competitors.
B5 The presence of joint activities in collaboration with universities and/or research institutions focused on the technical development of the sector.
B6 The presence of dedicated persons for the co-ordination and linking activities with competitors.
C) Stakeholder engagement
(The influence the stakeholder has on the company – biased– and colour dimension cataloguing of the crisis profile)
C1 Focus group or audit activities, consultancies etc. for the evaluation of joint communication strategies as to lobbying, or the implementation of product processes in the sector
C2 The activity of “return” or sharing of the progress made in the area of research and development, in favour of the community of professionals and competitors.
C3 The adoption of disclosure policies or anticipation of market releases.
10) Territory
A) The influence the stakeholder has on the company
(horizontal axis : the company is influenced by the stakeholder/ is not influenced).
A1 In the recent past, has this company had particular tension with this stakeholder? The legend below shows how to assign a score to this question:
| > 7 crisis in the last 5 years | -2.00 |
| Between 4 and 7 crisis in the last 5 years | -1.00 |
| Between 2 and 3 crisis in the last 5 years | 0 |
| 1 crisis in the last 5 years | 1.00 |
| No crisi in the last 5 years | 2.00 |
A2 How the company is considered in the referent community.
A3 Managerial capacity, through the implementation of crisis management of the tension associated to this stakeholder.
A4 How the company is considered in terms of quality of relationships with this stakeholder (is it considered the best in class/leader, follower, does it follow and reproduce others’ best practice, the worst, is there a person responsible for public relations with this stakeholder present in the company?)[18]
B) The influence the company has on the stakeholder
(vertical axis: the stakeholder is influenced by the company/is not influenced).
B1 The presence of a unit responsible for dealings with media relationships dedicated to local realities (local media or those in the neighbourhood, local institutions etc…)
B2 The presence of person/s within the company encharged with local relationships both on the territory where the company itself is located and the territories belonging to its branches.
B3 Sponsorships or other forms of company participation in cultural, sports, folklore events etc…held in the area where the company is located.
B4 The concession and/or sharing of spaces and/or company resources for manifestations or initiatives promoted by the territory (e.g. concerts, courses, training events, conventions etc….)
B5 The promotion of Special Days “open to all” where the company meets with the local people and makes itself known through permitting them to enter inside the company and visit it.
B6 The willingness to provide for guided school visits and other forms of education for the younger members of the general public.
B7 Collaboration (sponsorship) with health-care, educational, cultural institutions etc…in the area where the company is situated.
C) Stakeholder engagement
(The influence the stakeholder has on the company – biased – and colour dimension: cataloguing of the crisis profile)
C1 The willingness shown towards meetings with local representatives, local associations, administrators, citizen associations?
C2 Focus groups for the disclosure and/or participatory discussions on industrial plans, development, etc…
C3 The company’s participation in local development plans or other forms of investment on the territory.
C4 Participation in comparison boards for shared planning with local administrators, or the promotion of such should they not be foreseen.
C5 Reporting of the public relations activities on the social report.
C6 Dissemination of the social report at a local level.
11) Intermediaries / correspondents / retailers
A) The influence the stakeholder has on the company
(horizontal axis: the company is influenced by the stakeholder/ is not influenced)
A1 The importance the company places on the stakeholder on the basis of thorough auditing of the marketing department, or other sectors involved in direct relationships with this stakeholder.
A2 In the recent past, has this company had particular tension with this stakeholder? The legend below shows how to assign a score to this question:
| > 7 crisis in the last 5 years | -2.00 |
| Between 4 and 7 crisis in the last 5 years | -1.00 |
| Between 2 and 3 crisis in the last 5 years | 0 |
| 1 crisis in the last 5 years | 1.00 |
| No crisis in the last 5 years | 2.00 |
A3 The preponderance of suppliers the company is a Primary, main, priority client for, or in any case, relevant in terms of percentage in their turnover.
A4 The solidity of the relationship with strategic retailers (starting from audits on the company report, how long there has been a relationship with them and the quality of this relationship, annex documentation of this reference).
A5 Managerial capacity, through the implementation of crisis management of the tension associated to this stakeholder.
A6 Consideration of the company in terms of their relationship with this stakeholder (is it considered the best in class/leader, follower, does it follow and reproduce others’ best practice, the worst, is there a person in the company entrusted with relationships with this stakeholder?)[19]
B) The influence the company has on the stakeholder
(vertical axis : the stakeholder is influenced by the company/ is not influenced).
B1 Is there adoption of pricing policies that respect the small retailers (taking into particular consideration those that are strategic for geographical reasons, or those that have a particular quality approach- or are these “cannibalised” and “bypassed” in favour of the large stores, which, however, guarantee large volumes in terms of sales?
B2 The presence of forms of safeguarding for small retailers.
B3 The implementation of selection and management policies for retailers.
B4 Trasparency in contract criteria.
B5 Respect for the terms of payment.
B6 The application of the criteria laid out in the company’s code of ethics also to etailers.
B7 Promotional activities also in support of the retailers.
B8 “Below the line” (BTL) communication (i.e. communications that make use of use of more niche focused media).
B9 Awards and incentives, based, not only on sales volume, but also on qualitative aspects.
C) Stakeholder engagement
(The influence the stakeholder has on the company – biased – and colour dimension: cataloguing of the crisis)
C1 Active participation in Brand promotion activities, in the Brand community, at events etc…..
C2 Consultancy services to implement the ethical and qualitative profile.
C3 Credit facilities or other financial facilities for retailers in temporary difficulty.
C4 Corporate sharing /co-branding/other forms of horizontal integration (including strategic and corporate strategies) with retailers and distributors.
C5 Other forms of partnership (e.g. joint design or other co-owned brand products, innovation and development, shared informatic platforms etc.)
C6 The degree of particiapation development ininnovations within the company through the analysis of the policies governing sharing and the management of patent protection (licensing, etc.): starting from the definition of the “low” score, indicate on the form on page, if profit arises from this participation.
C7 Joint participation in fares, conventions in the industrial sector etc…
C8 Meetings, focus groups and other moments of shared strategies and comparison that are not strictly “product oriented”.
C9 Joint initiatives for the engagement of their respective employees (training, company voluntary work etc.).
C10 The predisposition for privileged “release” in the company reports (economic, market and social) for key retailers.
C11 The publication of the reporting/certification of the best practice associated to this stakeholder in the social report.
The author (brief biography)
Luca Poma was born in Torino, Italy on 16th February,1972. After fulfilling his high school studies he continued his education specialising in communication techniques and public and institutional relations. As from the year 1994, he has been entrusted with collaboration roles with public entities and intuitions, at local, regional and national levels, which can be read in detail in his social C.V. available on internet. As from the year 1997, he has been collaborating with a British consultancy company, covering a pubic affairs role that entails the guidance/management of a work team with missions in the USA, Benin, Jordan, India, Switzerland, France, Germany, Great Britain, Brittany, Luxembourg, Monaco, Kenya, Brazil, Morocco, Tanzania, Malaysia, Uruguay, Argentina, Russia, Romania, Hungary, China, Taiwan and the United Arab Emirates.
He is an official member of the Italian association of journalists (registration number 115319). He is a member of the Italian federation of public relations (FERPI – Federazione Relazioni Pubbliche ed Istituzionali) in the section “Professional persons” (“Professionisti” ) with registration number 02159. He is a member of the “Club Comunicazione d’Impresa” dell’Unione Industriale di Torino” (Company Commincations- Industrial Union, Turin). He teaches communications in the health sector at the 1st level Masters Degree course in Health Systems at the Bicocca University, Milan and has been professor and speaker at about one hundred conferences and seminars throughout Italy, has published over one hundred articles and essays – including the innovative “Reti Neurali Complesse” – and, over the last five years, has released more than two hundred and fifty interviews through the media, both on television and for newspapers/journals. The on-line encyclopaedia, Wikipedia has listed him in a section named “Giornalisti italiani del XXI Secolo” (XXI century Italian journalists under the letter “P”). He has created and set up an innovative unpublished model of stakeholder mapping and constantly innovates in his field of work: he has theorized the application of game theory to public relations, as well as that of fuzzy logic and fuzzy sets to biological psychology to corporate social responsibility and the theory of entropy to crisis communication.
He has created and promoted the most visible campaign for paediatric pharmacovigilance in Europe (www.giulemanidaibambini.org) as well as being responsible for coordinating relationships between the one hundred and ninety consortium boards and has been encharged with the role of National Spokesperson – of media relations and public institutions. His commitment and dedication to the service of safeguarding childhood earned him and his association “Giù le Mani dai Bambini”® (Hands off the Children ®) a prestigious national award, the Italian Senate Siler Medal, awarded by the President of the Italian Republic for social merits on November 20, 2007 at the United Nations Children’s Day. He contributed to the strategic planning of communications in Italy of the World March for Peace (http://www.marciamondiale.org/), an initiative aimed at enhancing awareness of non-violence, that wound its way for160,000 kilometres, through 90 countries worldwide. His work has been the subject of study in 5 Italian universities, where theses have been discussed on his work and strategies on public affairs. He is a specialist in communication strategies, negotiations and the manipulation of consent.
Short bibliography
The works cited in the chapters of this essay entitled “Le reti neurali complesse” are “A logical calculus of the ideas immanent in nervous activity” (W. S. Mc Culloch and W. Pitts, realy ‘40s), “The organization of behavior” (D. O. Hebb, late ‘40s) and “Phychological review” (F. Rosenblatt, late ’50s).
Here is some brief bibliography on these questions:
[1] This work was released with the licence Creative Commons Attribution- Non Commercial 3.0 Unported.
If you wish to read a copy of the licence, please visit the web site http://creativecommons.org/licenses/by-nc/3.0/, or send a written request to Creative Commons, 171 Second Street, Suite 300, San Francisco, California, 94105, USA
2 I describe this concept in more detail in a paper published by Ferpi, in the 1st number of “I quaderni delle RP”, entitled “Siamo tutti stakeholder…ma…? “, (we are all stakeholders…but?) along with an adequate bibliography to support these thesis.
[3] This concept is developed in the essay “Teoria dell entropia’: comunicazione di crisi e rapporti con la CSR”, published in Ferpi News in January, 2011 and e reiterates the relationship of “dependance” that ties Crisis Management and Crisis Communication to CSR
[4] You can see an example of a stakeholder’s map published in GUNA S.p.a.’s social report at URL www.guna.it/bilanciosociale2009, page 20 onwards.
[5] The method I discuss in this article was subject of a thesis in the Master course held at the SDA Bocconi “Gestione dell’impresa sociale, non-profit e cooperativa”(December 2010), the thesis is signed by the candidate Francesca Delpiano, who also made an active contribution on my staff working with Luca Yuri Toselli in perfecting the method herein described -and I should like to take this opportunity to thank her.
[6] This outline takes as examples, only the first 5 stakeholders for whom, initially- in the project phase of the method- checklists were elaborated.
[7] the classification of the a classification of the development phases has been taken from “Fasi dell’apprendimento conoscitivo – Manuale dello stakeholder Engagement” – Vol.2, Accountability – United Nations Environment Program, Stakeholder Research Associates (2005).
[8] The license offers the possibility to use the “protected” body of knowledge without the need for any previous authorisation, in as much as it is not profit orientated, neither direct, nor indirect, the only obligation is that of always quoting the original source and further enrichment in terms of shared knowledge.
[9] You may get in touch with me if you wish, at my e-mail lucapoma@lucapoma.info or staff@lucapoma.info
[10] One of the “fathers” of Italian PR , Past-President of the Italian Federation of Public Relations, expert in International public relations, Past President of the Global Alliance for Public Relations and Communication Management and currently special advisor to the President, Professor of Global Relations and Intercultural Communication at New York University and Professor of Public Relations at the LUMSA university of Rome.
[11] Guna S.p.A., Social Report for 2010 (in the sharing phase, closure is planned at the end of June 2011) at the address www.guna.it/letueidee and social report, 2011 (it will be in the sharing phase as from early July, 2011) at www.guna.it/webcam
[12] For this question the parameters relevant to the GRI may be used, along with an analysis of the company press releases, press reviews of the relevant sector, participation in conferences and seminars, awards etc..
[13] For this question the parameters relevant to the GRI may be used, along with an analysis of the company press releases, press reviews of the relevant sector, participation in conferences and seminars, awards etc..
[14] For this question the parameters relevant to the GRI may be used, along with an analysis of the company press releases, press reviews of the relevant sector, participation in conferences and seminars, awards etc..
[15] For this question the parameters relevant to the GRI may be used, along with an analysis of the company press releases, press reviews of the relevant sector, participation in conferences and seminars, awards etc..
[16] For this question the parameters relevant to the GRI may be used, along with an analysis of the company press releases, press reviews of the relevant sector, participation in conferences and seminars, awards etc..
[17] For this question the parameters relevant to the GRI may be used, along with an analysis of the company press releases, press reviews of the relevant sector, participation in conferences and seminars, awards etc..
[18] For this question the parameters relevant to the GRI may be used, along with an analysis of the company press releases, press reviews of the relevant sector, participation in conferences and seminars, awards etc..
[19] For this question the parameters relevant to the GRI may be used, along with an analysis of the company press releases, press reviews of the relevant sector, participation in conferences and seminars, awards etc..